


Turning Japanese I Think We’re Turning Japanese I Really Think So (follow up)
There is only one explanation for why 2 year US Treasury yields broke below 0.5% today (an all time low), or why 10 year government bond yields in Germany and the US are currently 2.5% and 2.9% respectively. Or, for that matter, why German 30 year bunds are now at just 3.2%. The bond markets clearly think there is a very real and increasing risk that the developed countries are going to end up looking like Japan. James Bullard of the Federal Reserve made this point in a recent academic paper, where he argued there’s a possibility that “the US economy may become enmeshed in a Japanese-style, deflationary outcome within the next several years”.
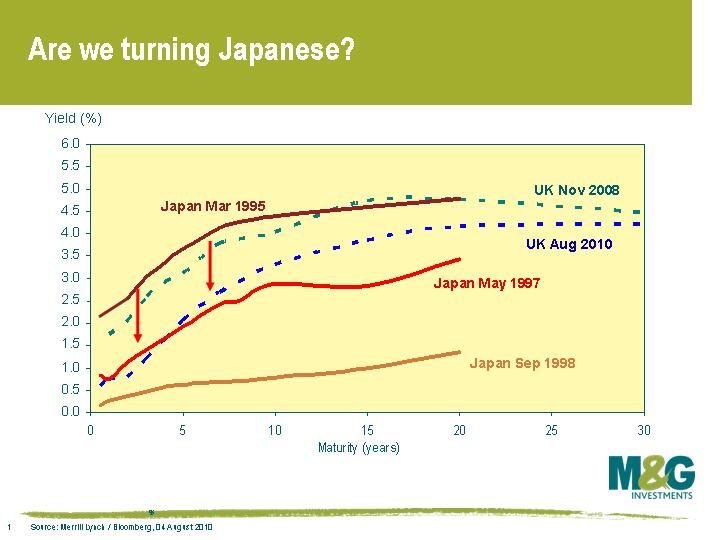
It’s interesting to look back at how sovereign bond markets have moved since November 2008, when I last made the Japan comparison on this blog (see here). In autumn 2008, the UK yield curve looked like Japan’s did in March 1995. Just under two years later, and the UK curve and indeed many other countries’ yield curves look similar to Japan’s in May 1997 (see chart).
Is the market justified in believing that we’re turning Japanese? Some may argue that the economic recovery in the developed world from early 2009 has looked distinctly un-Japanese. Preliminary figures for real UK GDP in Q2 were +1.1% (unannualised), the fastest pace of expansion since Q1 2001. US GDP hit an annualised rate of +5.0% in Q4 2009 and +3.7% in Q1 2010. While the recent estimate for US GDP in Q2 was a weaker +2.4%, global economic data (even in the US) is not (yet) suggesting anything worse than a modest slowdown.
However, Japan’s growth initially followed a similar path in the mid 1990s – the year on year real growth rate remained positive in every quarter from Q2 1994 to Q3 1997, averaging a healthy +2.1%. The problem was that what appeared to be reasonable growth was a result of a huge surge in government spending and monetary stimulus. It wasn’t sustainable. A lack of consumer demand, a broken banking system and falling asset prices then combined to feed into falling inflation. Core inflation (ex food and energy) fell from 2.3% at the end of 1992 down to 0.5% in 1995-1996. Headline inflation briefly dipped below zero in 1994-5, and both measures fell below zero in 1998 and have stayed there more or less ever since. The Japanese authorities weren’t able to do much in reaction to this fall in inflation – monetary policy became ineffective once rates hit 0.5% in September 1995.
The worrying thing for the developed world is that cuts in the Bank rate tend to take 18 months to have a full effect on an economy, and it’s perhaps no coincidence that the slowdown that hit the US a few months ago has come 18 months after the final Fed rate cut in December 2008. The only path left for central banks is unconventional monetary policy, and is something that developed economies began last year. While the policies haven’t been totally ineffective (the Bank of England estimates gilt yields are 1% lower as a result) and we’ll never know what would have happened without the extraordinary measures, money supply growth is still generally weak or falling. Developed world economies appear to have fallen into a liquidity trap, as argued by Paul Krugman here. This has serious consequences – if policy makers are running a Zero Interest Rate Policy (ZIRP) and inflation is falling, then real interest rates are rising. And if the economy falls into deflation, then you have positive real interest rates precisely when you don’t want them, ie monetary policy is tightening.
The Japanese actually had a big advantage over us – thanks to Japan’s huge domestic savings, the authorities were able to channel a huge amount of money into the domestic government bond market and were therefore able to maintain huge budget deficits and run up massive public debt levels (public/debt GDP is now over 200%). This fiscal stimulus is a luxury that most developed countries don’t currently have. We’ve had unprecedented monetary and fiscal stimuli since Q4 2008, but bond markets are forcing most governments to withdraw fiscal stimuli. Further stimuli would increase the risk of sovereign insolvency.
So now, not only are we facing deleveraging in the household sector and the financial sector, but we’re also about to face deleveraging from the public sector. The consequence of deleveraging ought to be lower growth and lower inflation and this appears to be happening. Monthly headline US CPI has now fallen for three consecutive months, which has only happened a handful of times since the data series began in 1947. Eurozone CPI is 1.4% year on year, and that’s even before the fiscal austerity has really started. The UK appears to be the exception, although while inflation is a concern as mentioned previously here, inflationary pressure can be largely attributed to the combination of a VAT increase and the lagged effect of previous sterling weakness (and note that sterling has strengthened about 8% since the beginning of March on a trade weighted basis so currency strength should soon begin to have the opposite effect).
If you take the old rule of thumb that a 10 year government bond yield should equal the long term growth rate plus the long term inflation rate, then it’s clear that bond markets are pricing in a grim scenario. Other risky assets arguably aren’t though, and there’s a clear disconnect. If the majority of the global economy does indeed go the way of Japan, I suspect that a lot of seemingly cheap assets will get even cheaper.
The value of investments will fluctuate, which will cause prices to fall as well as rise and you may not get back the original amount you invested. Past performance is not a guide to future performance.
19 years of comment
Discover historical blogs from our extensive archive with our Blast from the past feature. View the most popular blogs posted this month - 5, 10 or 15 years ago!


Bond Vigilantes
Get Bond Vigilantes updates straight to your inbox