high yield
Mind the gap: Is high yield paid for the jump?
By Stefan Isaacs
3 November 2026





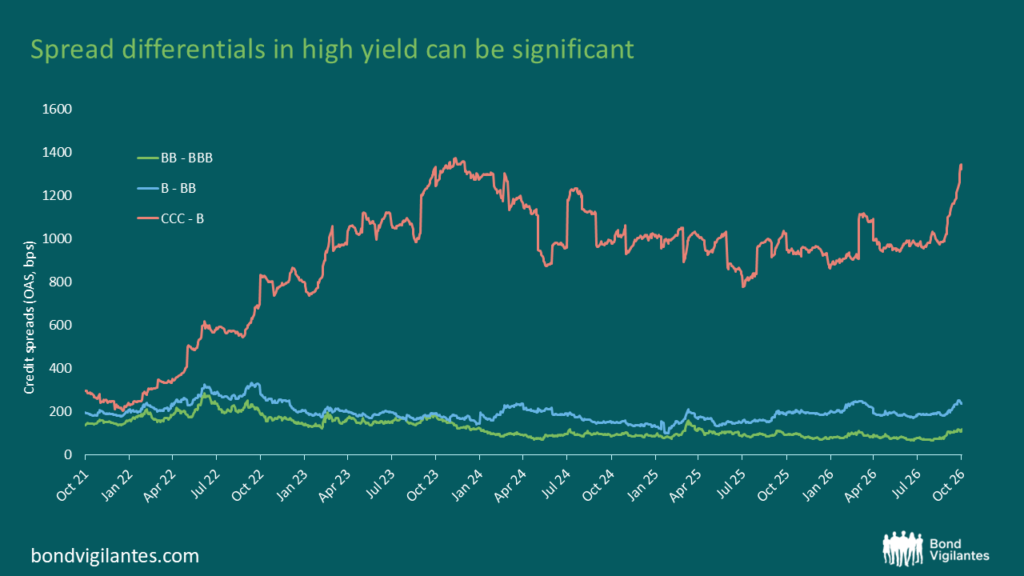
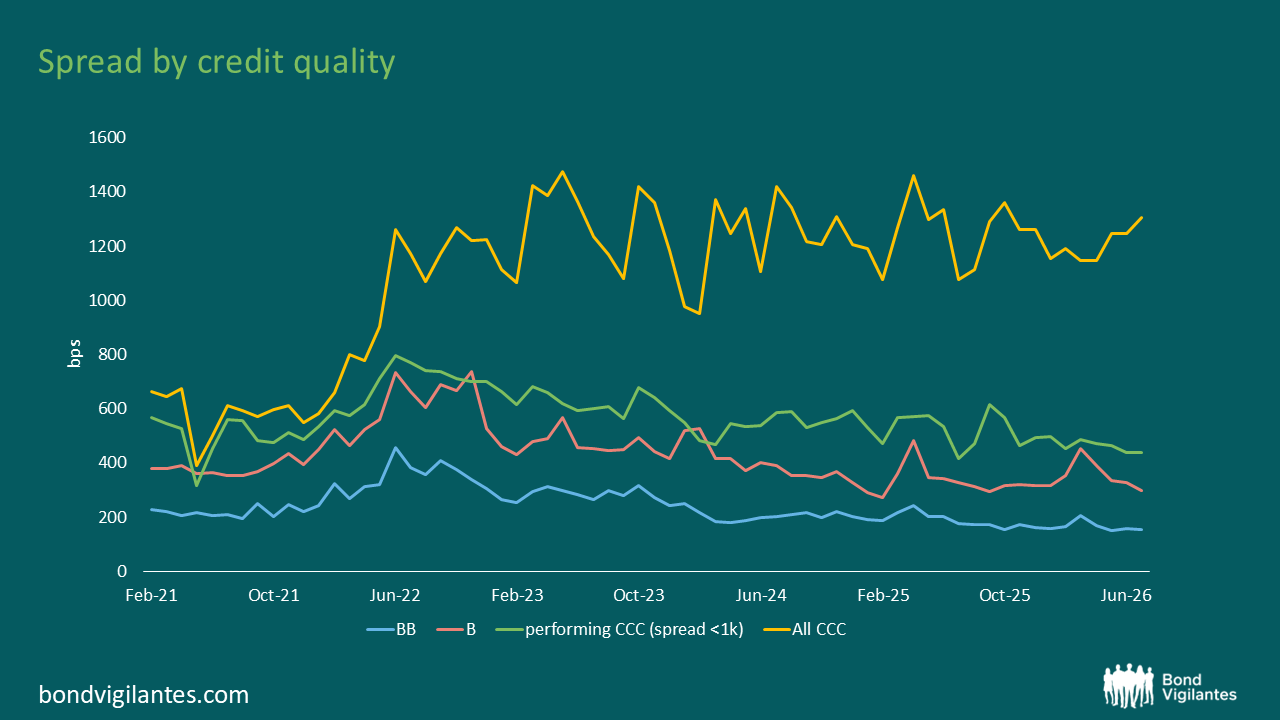
In a world of tight credit spreads, one rating bucket flashes value. The European CCC index offers 1,306 bps over government bonds, suggesting generous compensation for taking credit risk.
But the spread is deeply misleading.
The CCC market contains two very different groups: performing companies that are riskier but continue to meet their obligations, trading on spread, and distressed companies that are trading on expected recovery values following a restructuring. Combining the two produces an index spread that describes neither particularly well.
Performing CCC bonds, defined here as those trading below 1,000 bps – a common threshold for distress – currently offer a spread of 438 bps. That is tight by historical standards and much closer to the spreads available from higher-rated single-B bonds than the headline CCC figure suggests.
These are companies that the market broadly expects to continue servicing their debt. Investors still face meaningful default, downgrade and liquidity risk, but they are not being paid anything close to 1,306 bps to accept it.
Above 1,000 bps, the analysis for a bond changes. The outcome and timing of a potential restructuring dominate the price of the bond. The lower chance of a return to par makes the spread a poor guide.
The aggregate CCC spread therefore combines conventional spread assets with potential recovery assets and so is a poor guide to the compensation available on performing CCC risk.
Source: Bloomberg, ICE BofA BB Euro High Yield Index (HE10), ICE BofA Single-B Euro High Yield Index (HE20), ICE BofA CCC & Lower Euro High Yield Index (HE30)
CCCs account for only 4.3% of the European high yield index. If the distortion were confined to that small part of the market, it would be interesting but of limited relevance. It is not confined to CCCs.
Across the broader European high yield market, a relatively small number of distressed bonds can have a disproportionate effect on the average spread. These securities record extremely high spreads even when spread is no longer the most useful way of valuing them. Their presence pushes the average above the level available on most performing bonds.
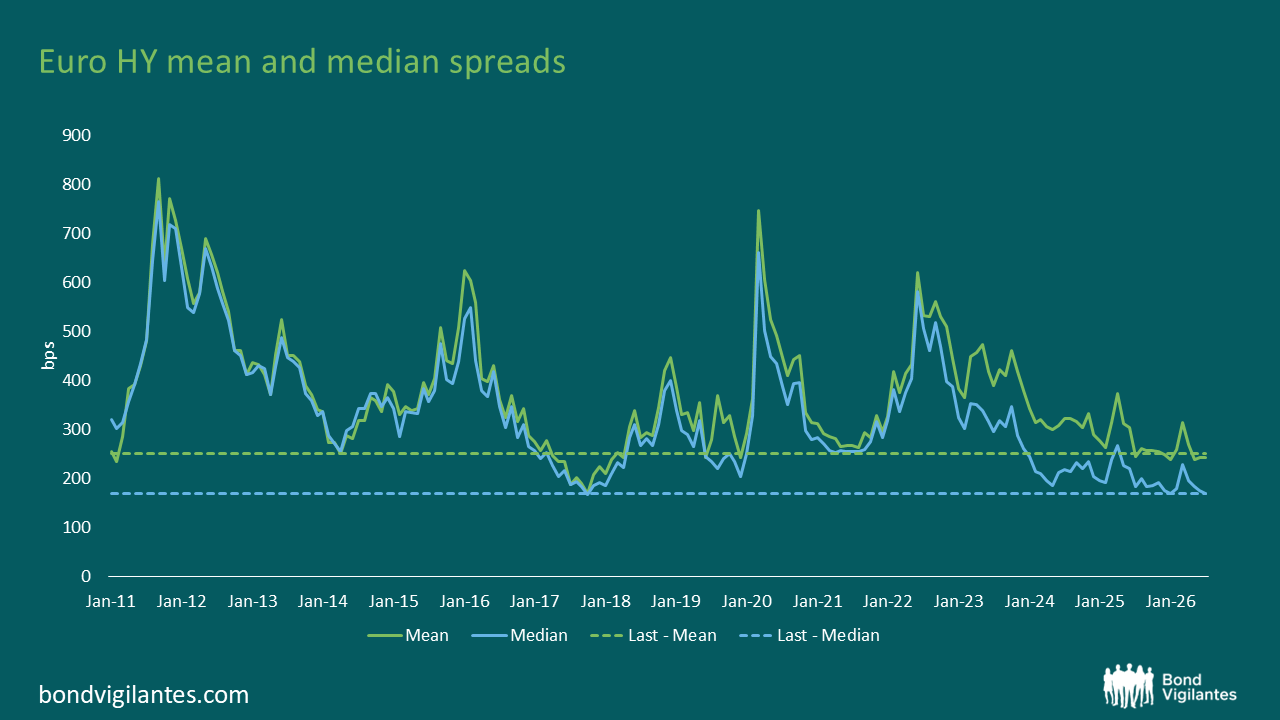
The gap between the mean and median illustrates the effect. The mean is sensitive to the size of the observations in the distressed tail. The median is not. It identifies the spread on the middle bond in the distribution, regardless of how extreme the widest spreads become.
The median spread gives a better indication of spreads for a typical bond and hence the outlook for future excess returns.
At present, those two perspectives tell different stories. The headline mean index spread of 244 bps suggests that European high yield offers reasonable compensation. The median, which at 169 bps is close to the tight end of its range over the last 5 years, suggests that the typical performing bond is priced much more aggressively.
Source: Bloomberg, ICE BofA Euro High Yield Index (HE00)
Most investors treat the index spread as a quick read on value. It isn’t always. When distressed bonds contribute an outsized share of that spread, the headline flatters the performing market that makes up the bulk of what you can actually buy.
So the aggregate is the wrong anchor. For performing CCCs, the only question that matters is whether 438 bps pays you for the default, downgrade and liquidity risk you are taking versus a single-B. It is a thinner cushion than the index spread implies. Distressed CCCs are a different game entirely, priced on restructuring outcomes and recovery, not spread.
The lesson is to read the market through the median, the spread distribution and the share of bonds trading at distressed levels, not a single average that a small tail can distort.
In CCCs, the real risk is not always distress; it is paying too much for the credits that avoid it.
My Bloomberg monitor and my TV are telling me different stories. Headlines are dominated by conflict, energy shocks, and warnings about inflation and supply chains. Yet my Bloomberg screen suggests a very different picture: equities are at record highs and credit spreads are tight.
Single-Bs, however, haven’t got the memo. While all other credit grades have tightened since the Iran conflict began at the end of February, Euro single-Bs are wider (+12bps) and have seen the largest widening since the start of the year across all credit grades (+60bps).
So, what’s happening? Well it doesn’t seem to be a change in credit risk sentiment, as US Dollar single-Bs have tightened, as have the riskier triple-Cs. Flows into high yield have also been strong lately, boosted by an attractive yield and ongoing demand from fixed maturity funds, which tend to prefer double-Bs, often at the expense of single-Bs.
Single-Bs are certainly offering more relative value than they have in a while. But perhaps that’s not the right question. If they are the canary, the more important question is whether the rest of the credit market is listening?

The record breaking $55bn leveraged buyout (LBO) of Electronic Arts (EA) is expected to close this year. But in a twist that could madden bondholders, EA is tendering for its bonds well below par instead of honouring the 101 Change of Control provision, saving itself over $250m at bondholders’ expense.
Many bonds include a Change of Control clause that requires the issuer to offer to repurchase at 101 in the event of a takeover. The idea is to protect bondholders from a deterioration in credit quality if a weaker owner takes charge.
EA had two bonds outstanding when the LBO was announced last year. Before the announcement, the bonds were Investment grade rated and traded around 100bps over Treasuries. Because they were issued in the low‑rate environment of 2021, coupons were just 1.85% (2031s) and 2.95% (2051s). In the higher‑rate environment of 2025, a 100 bps spread translated to a price near 65 for the 2051s. On hopes of a 101 payout, those bonds jumped almost 50% to around 90.
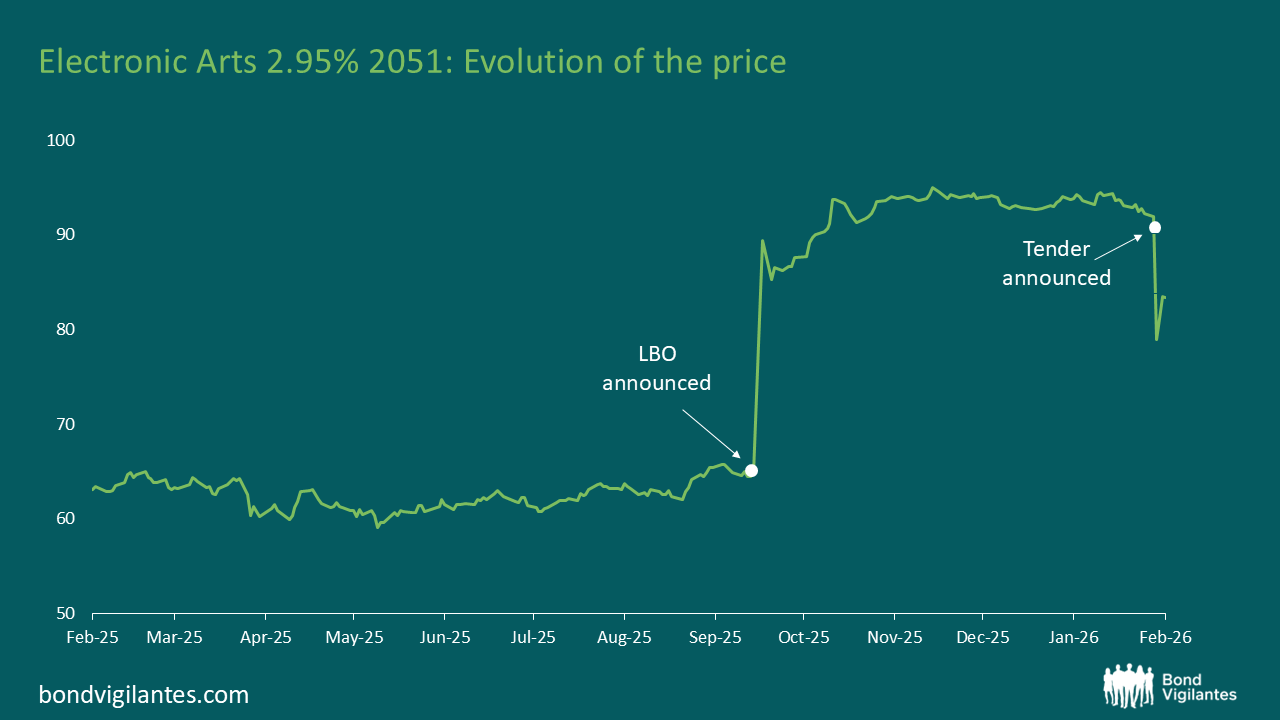
EA is now gaming bondholders by offering to buy the bonds at a flat spread to Treasuries (plus a 50bps early consent fee), which currently equates to c. 74 for the 2051s.
Is it game over for bondholders? Practically speaking, they have little choice but to accept. EA will use defeasance, an archaic but legitimate mechanism, to place the remaining bonds in trust. By backing the bonds with Treasuries (or cash), EA is relieved of ongoing covenant obligations, including the Change of Control. Holders who refuse the tender will be left with an instrument that has the payment certainty of US Treasuries but dreadful liquidity.
The savings for EA are material in absolute terms: over $250m versus the higher 101 payout. Even if bondholders don’t tender, EA can defease with long Treasuries that have fallen far as yields have risen. For example, the US Treasury 1.875% 2051 trades in the mid‑50s.
Bondholders will argue that $250m is small in relative terms of a $55bn transaction, and perhaps that EA will find it harder to place the $20bn of LBO debt should it alienate the market. Current secondary pricing above the tender level suggests there is a chance EA relents. Even so, the recent fall in software valuations may encourage the sponsors to squeeze every part of the structure to make the deal work.
The coronavirus pandemic and low oil prices have led to a surge in ‘fallen angels’, companies downgraded from investment grade to sub-investment grade. Ford, Kraft Heinz, Renault and Marks & Spencer are amongst the issuers that have become fallen angels so far this year.
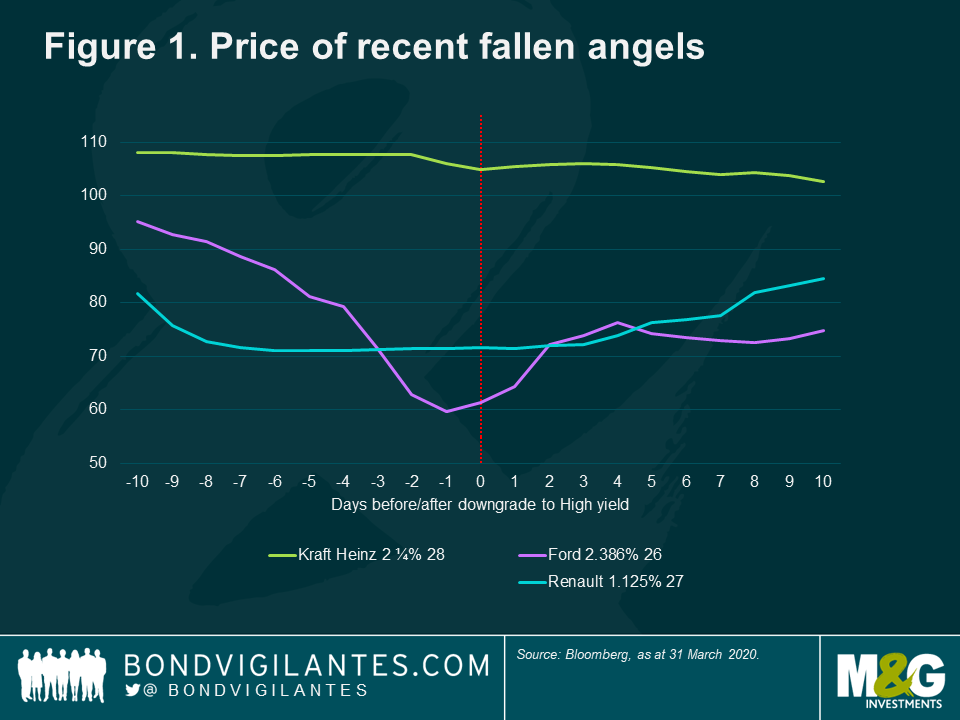
We often see price falls in such downgraded bonds. Investment grade (IG) and high yield (HY) are typically treated as separate silos in an investor’s portfolios, which can lead to significant turnover of bonds from IG portfolios to HY portfolios when an issuer is junked. Figure 1 below shows the price action of three recent fallen angels with Ford, which has the largest debt pile, falling the furthest. We can also see that the market often anticipates the rating action before the agencies act.
The relative size of the IG and HY markets, as shown in Figure 2 below, intensifies the price moves. BBBs now account for just under half of the euro IG market and is over four times the size of the European HY market. This isn’t a European phenomenon: US BBB accounts for 48% of the IG market, and the BBB market is over three times the size of the US HY market. This exacerbates the price movements as supply exceeds demand.
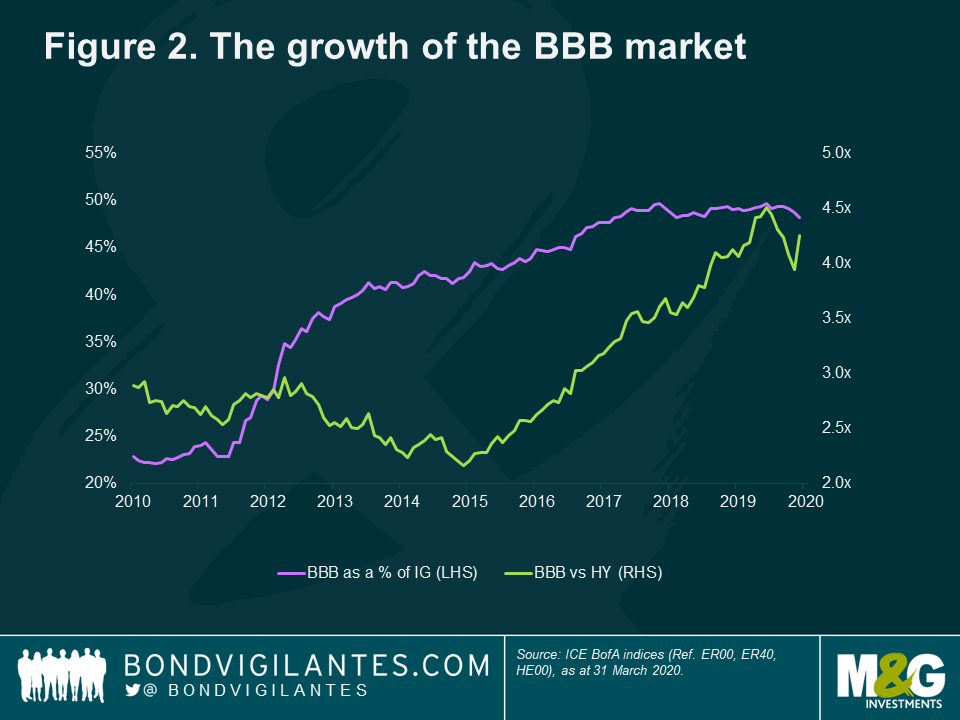
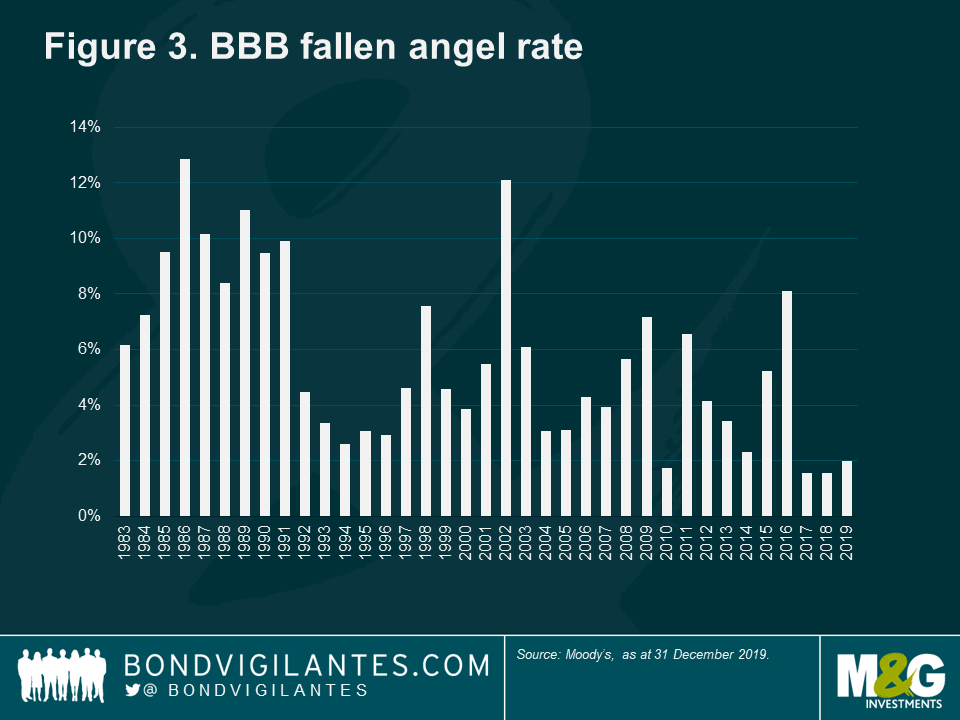
The growth of BBB rated debt has been well documented, but, until this crisis, most commentators were sanguine about the risk of heightened fallen angels (Figure 3 below). The rating agencies also seemed to give company managements the benefit of the doubt when they made debt-finance acquisitions.
But the crisis has spurred the agencies into action. S&P, for instance, has taken negative rating actions on 383 IG rated issuers affected by COVID-19 and oil to April 17th 20201. They have junked 23 issuers so far this year2.
There is huge potential for more fallen angels. There is €243bn of BBB- rated debt in the IG index, of which €107bn is either on rating watch negative or bears a negative outlook. The fallen angel rate of BBB issuers hit 12.88% in 19863 and a similar rate would see €156bn of euro fallen angels and $457bn in the US market. Goldman Sachs forecast €180bn of fallen angels in the euro market over the next two quarters4.
The Opportunity
So we see a surge of fallen angels and expect their prices to fall due to the relative size of the IG and HY market. Is there any good news?
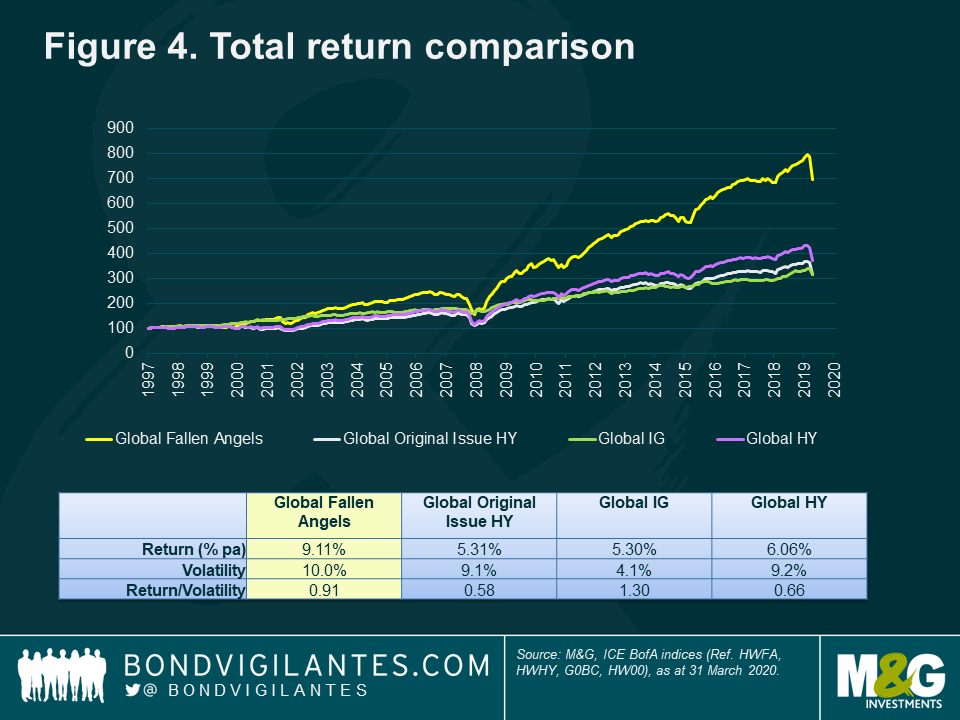
Fortunately, the answer is yes. When we look at Figure 4, which shows the performance of fallen angels versus other HY (called ‘original issue HY’) and IG, we see that fallen angels have outperformed over the long term.
The fallen angel index isn’t for the faint hearted – the size of the market waxes and wanes and will sometimes be highly concentrated. Volatility is higher than that of HY. But the long term performance is compelling as the higher returns compensate for the higher volatility. In fact, as shown in Figure 5 below, fallen angels have only underperformed original issue HY over a rolling three-year period in 10 out of the last 232 months.
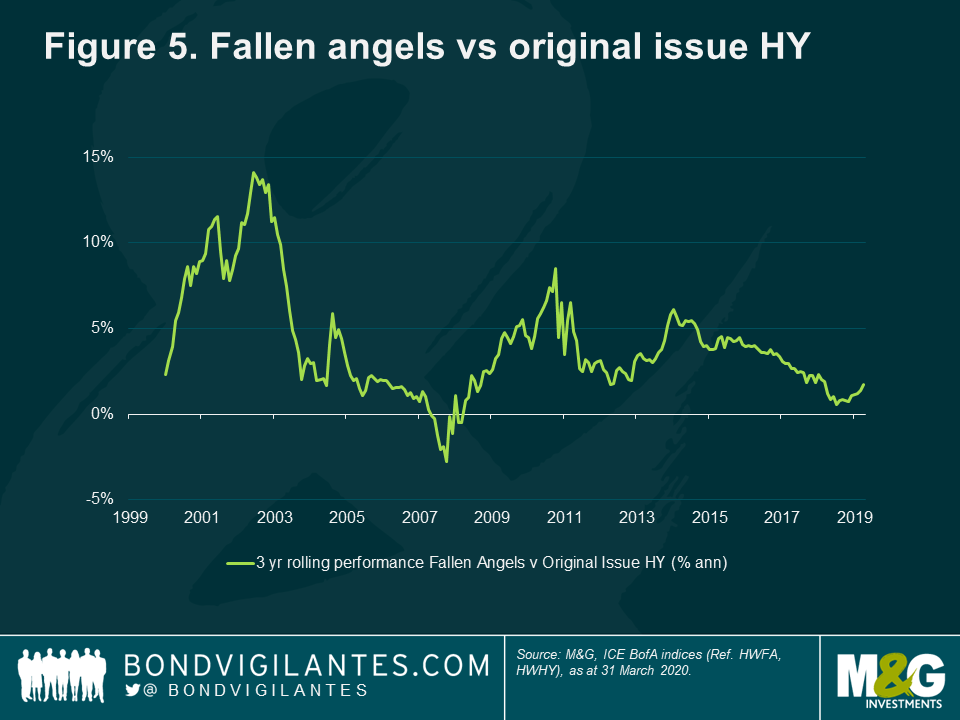
How can this outperformance be explained? It is because the prices fall initially making them cheap, and over the longer term the survivors are more likely to return to IG as a ‘rising star’ than original HY issuer.
The churn of bonds from the IG to HY market causes prices to fall, and this is exacerbated not only by the relative size of the markets, but also because IG issuers often have much longer dated bonds that are more sensitive to spread widening.
Fallen angels are both more likely to default and return to investment grade than original issue HY5. Initially, the risk of a fallen angel defaulting is actually higher than original issue HY. Fraudulent companies default soon after downgrade to sub-investment grade. Enron defaulted six days after being junked. However, after a year or so, a fallen angel has a higher chance of becoming a rising star and return to investment grade. This is because fallen angels have several of the characteristics, such as size and industry type, required to for an IG rating that other HY issuers lack.
Conclusions
We expect this current episode lead to a surge in fallen angels. This will lead to mark to market volatility in the short term as IG holders sell to HY investors. The lesson from history is that the bonds of survivors achieve outsized returns.
3 Annual default study: Defaults will edge higher in 2020, Moody’s, 30 January 2020
4 The Credit Line: The two sides of “fallen-angel” downgrades: Risk vs. risk premium, Goldman Sachs, 20 April 2020
5 What Happens To Fallen Angels? A Statistical Review 1982—2003, Moody’s, July 2003
CDOs (Collateralised Debt Obligations) are being hailed in some quarters as the next split cap catastrophe. As a result of the US sub prime mortgage crisis, some CDOs that are heavily exposed to the US subprime mortgage crisis have fallen dramatically in value and hedge funds that have a big exposure to these CDOs are on the brink of collapse. There are legitimate concerns with some aspects of the CDO market and perhaps the biggest one is that there isn’t a hell of a lot of confidence that the ratings agencies are on the ball (see my previous comment). Mervyn King touched on this subject at a recent speech too (as reported by Richard here). However, a lot of fear and confusion about CDOs comes from a lack of understanding of what they actually are.
A CDO is essentially just like an asset backed security (ABS). The assets that form the collateral for ABS deals are usually pools of credit card loans or car loans, but they could theoretically be anything that throws out a cash stream. David Bowie sold the rights to his songs for $55m in 1997 by issuing a Bowie bond, while Calvin Klein once issued a bond linked to future sales of its perfume products.
In a basic CDO, the collateral is a diverse portfolio of corporate bonds, high yield bonds, asset backed securities, mortgage backed securities and/or leveraged loans. The cash flows from this portfolio are then repackaged into different tranches, each with different risk and return characteristics and these tranches are sold to investors. Cash flows are received by the investors in the lowest risk tranche first, while the highest risk tranche receives cash flows last.
The highest rated tranche forms about 70% of the structure of a CDO and carries an AAA rating because it is the first in the queue and there would have to be a huge number of defaults in the underlying portfolio (about 30%) before any of the AAA rated investors start getting hit. Credit ratings of the tranches deteriorate as you go further down the queue, reflecting the fact that there’s less of a buffer, and right at the bottom is an unrated ‘equity’ tranche which is first in the firing line if things go wrong. Investors in the equity tranche stand to make fantastic returns as long as nothing defaults in the underlying portfolio, but as soon as anything does go bust then these investors start getting hit. And that’s exactly what’s happening now in the US.
Some CDOs have been heavily invested in mortgage backed securities, which themselves were backed by pools of subprime mortgages. These mortgage backed securities may have once been rated BBB, but now that so many US sub prime borrowers are defaulting, the credit ratings of these mortgage backed securities have plummeted. Many investors in CDO equity tranches are hedge funds, who were attracted to the prospect of returns of over 20% per year. Unfortunately, it seems that some investors in CDO equity tranches have also been pension funds, whose gullible trustees clearly didn’t have clue what they were getting into and have failed in their fiduciary duty.
Are all CDOs bad? As long as the underlying collateral is of sound quality, then they’re not bad at all. So called ‘CDO squared’ products, which are CDOs invested in other CDOs (this stuff really is a bit like split caps) are potentially poisonous, but they’re really not that common. CDOs in which the collateral is leveraged loans (these are Collateralised Loan Obligations, or CLOs) are actually very attractive right now and Richard has bought some for the M&G Optimal Income Fund.
In any area that has seen such phenomenal growth, there are likely to be some cases of abuse of the system, but that doesn’t absolve sophisticated investors of not reading the small print, or understanding the investment they are buying. It should also not deflect from how CDOs can offer attractive investment opportunities.
Rating agencies have come under fire recently. A number of perceived gaffs haven’t helped the agencies’ credibility (we covered Moody’s changes to its bank rating methodology on this blog), but the biggest concern at present is regarding structured credit.
Some investors have always treated ratings agencies with a degree of scepticism, arguing that there must be a conflict of interest when companies are the ones who pay agencies to rate their own bonds and deals. This scepticism has grown with structured credit, because agencies can earn twice as much as they could for rating a conventional corporate bond. There is also widespread concern that the agencies lack the resources to properly analyse complicated structured credit, because the best brains at the ratings agencies often get snatched up by the investment banks and fund managers.
S&P yesterday hit back, releasing a report entitled “The Covenant Lite Juggernaut is Raising CLO Risks – And Standard & Poor’s is Responding”. The background to this report was that ratings agencies had been criticised over their lack of action over what are perceived to be increasingly risky leveraged loan deals. An increase in risk of leveraged loans meant that the credit ratings given to CLOs, which are asset backed securities backed by a pool of leveraged loans, were perhaps not reflecting the true credit risk. “Covenant Lite” deals, where the legal protections for investors are weaker, worry us (see here for my earlier blog article).
Without going into too much detail, S&P have made changes to their criteria for rating CLOs, including assuming a 10% lower recovery rate for leveraged loans that come with the “covenant lite” tag. While this is an improvement, we remain cautious over covenant lite deals – the great attraction of the leveraged loan asset class to us has always been its seniority and high recovery rates in event of default, and anything that jeopardises this makes us nervous.
20 years after Gordon Gekko told us that “Greed is Good” in Wall Street, 20th Century Fox has announced that a sequel called “Money Never Sleeps” is in pre-production. Is this the top of the market for equities then? The last film was released just ahead of the 1987 crash.
You used to have to rely on a shoe-shine boy to give you a stock-tip to gauge if the markets were getting frothy, but more recently other sources have been quite good at providing clues. In 2000 Fox piloted “The $treet” and in November last year “Flipping Houses for Dummies” was published in the US.
In my catch up reading from holiday (Argentina – stunning and very very cheap!), I noticed that World Directories, a European telephone directory company, has re-financed its euro-denominated leverage loan to be ‘covenant-lite’. Covenants are very important for us as bond investors. This is because they impose restrictions on a company’s management by preventing management from undertaking activity that would not be considered bond-friendly. If a company violates covenants, bondholders have the power to restructure the company, impose additional covenants or even initiate bankruptcy proceedings. The trend towards covenant-lite issues in the leveraged loan market (where loans are being issued with weaker covenants akin to those seen in the high yield corporate bond market) is therefore grounds for concern for leveraged loan investors.
Leveraged loans have traditionally had strict covenants called ‘maintenance covenants’. These are covenants that issuers must comply with on a regular basis. These covenants vary from issue to issue, but may include limiting capital expenditure to a certain level, or preventing the issuer from breaching certain financial ratios.
‘Covenant-lite’ issues drop the maintenance covenants in favour of ‘incurrence covenants’. These covenants only refer to pre-determined events, such as the firm taking on additional debt or engaging in takeover activity. Incurrence covenants are more typical in the high yield corporate bond market – so when Apax (a private equity company) bought Travelex via leveraged buyout in 2005, Apax had to buy Travelex high yield bonds back above par value.
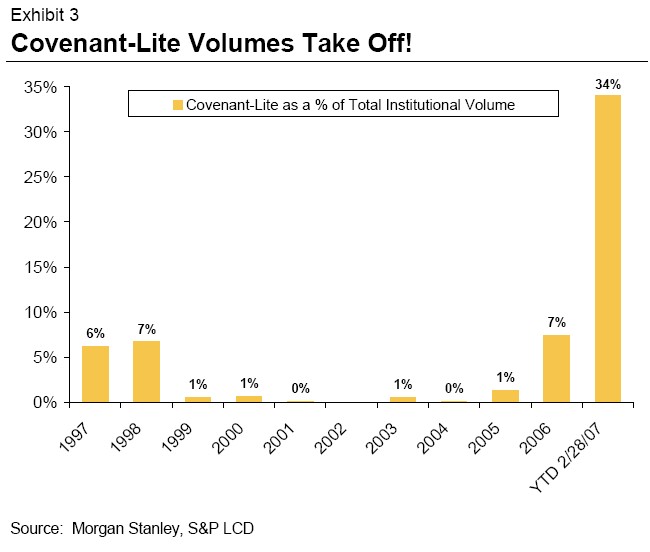 As the chart to the left illustrates (click to view full chart), covenant-lite issuance is a growing trend in the US leveraged loan market – there was more covenant-lite issuance in the first two months of this year than in the previous ten years put together.
I expect the rise in covenant-lite issuance to result in marginally lower default rates, since there will be fewer covenants to break and bond holders will not be able to force bankruptcy so easily. However, I would also anticipate lower recovery rates, because once companies do go bankrupt, there will be less left for bondholders. Covenant-lite issuance is a good example of how leveraged loan issuers are taking advantage of the huge demand for the asset class. This is because they are now able to issue loans with weaker covenants, but with very little additional spread.
PE funds raised $432bn last year globally, according to Private Equity Intelligence, which gives them firepower of around $2 trillion if they used 4 times as much debt to buy companies. And estimates suggest they may raise more in 2007, possibly $500bn. We should expect more Leveraged Buy-Outs (LBOs) in 2007, after all 8 out of the 10 largest LBOs of all time happened in 2006 after less money was raised in 2005.
What does this mean for corporate bond investors? Well bondholders of potential targets, likely to be investment grade, should make sure they are protected with covenants so they can get their money back. There are few places to hide when even Home Depot in the US is talked about as a target. High Yield investors are likely to see more issuance to fund the LBOs but should make sure that the PE fund hasn’t overpaid (multiples are rising as shareholders become less willing to be bought out cheaply).
But the more significant effect may be for corporate Europe to take on more debt and fall down the credit spectrum. Companies such as Portugal Telecom, currently being courted by Sonaecom, are offering special dividends funded by debt to fend off a takeover and so you could see their ratings fall to junk even if they are not taken over. This would bring the ratings of European companies more in line with US companies that have typically had more debt. Maybe one of the reasons for European companies having less debt than their US counterparts was a less established capital market for junk rated companies in Europe, but that fear should have eroded with the maturity of both the European High Yield and Leveraged Loan markets that are more able to finance lower rated companies.
Are CCC rated bonds compensating us enough for default risk? Based on historical default rates, the answer is a resounding “no”. Moody’s most recent annual default study looks at global default data from 1920-2005, and on a five year moving average, the historical global default rate for CCC rated bonds is a rather worrying 29.7%. So, if you bought a CCC rated bond now, based on an historical default rate, there is almost a 1 in 3 chance that the bond you bought would default over a five year period.
It’s all very well looking at historical averages, but are we in an “historically average” credit environment right now? Again, definitely not. The global economy had one of its strongest years ever in 2006, which goes a long way to explaining why defaults have remained so low. In Europe, following the default of Schefenacker, only 2 out of 155 companies’ bonds are trading at distressed levels (ie yielding 10% more than government bonds) indicating that they are likely to default soon.
Even though balance sheets are generally very healthy and the credit environment is very supportive, it is difficult to be bullish on something that is the most expensive it has ever been. In my funds I am being cautious on triple-Cs. Where I do hold them it is because they have short maturities or we think that they are likely to be refinanced. I’m not hooked




Sign up to the Bond Vigilantes mailing list to ensure you never miss a great article from our expert Bloggers. We will email all new articles to your inbox, meaning you can stay on top of the world of Bonds.
I confirm that I would like to receive information about Bond Vigilantes and products and services from M&G Securities Limited.
We will use the email address and personal data you have shared with us to send you this information. For existing customers, submitting your contact details and requesting to receive this information from us, will replace any earlier choices you have made in respect of marketing information.
You can unsubscribe from marketing at any time, at which point we will not send any further marketing information to you, by selecting the unsubscribe link in all communications.