high yield
Mind the gap: Is high yield paid for the jump?
By Stefan Isaacs
3 November 2026





Global bond markets rallied after the US Federal Reserve (Fed) signalled on Wednesday what financial markets had been pricing in for months: the central bank will most likely retract from its rate hiking plans this year, given the global economic slowdown, lower oil prices and generally muted domestic inflation. The Fed also indicated its balance sheet may not shrink as much as expected as it needs reserves to meet rising demand from national banks (required to own more Treasuries to strengthen their coffers). This dovish-squared message reminded investors of 2016, when previous Fed chair Janet Yellen was on course to start normalising rates 8 years after the financial crisis, but refrained from doing so, providing a favourable backdrop for risk assets (more below).
US inflation-linked securities rallied as the absence of higher rates may stoke inflation, while the US High Yield (HY) spread over Treasuries has now plunged to 430 basis points (bps), down from 537 bps earlier this year. Emerging Market (EM) currencies flew as the dollar fell: the Indonesian rupiah rallied more than 1% yesterday as the country embarked on defensive interest rate hikes last year to protect its currency while the Fed was raising rates, so investors are now speculating that rate cuts this year are possible. Sovereign bonds also outperformed, with the Treasury 10-year yield falling back to 2.66%, down from 2.78% only last week. Oil gained.
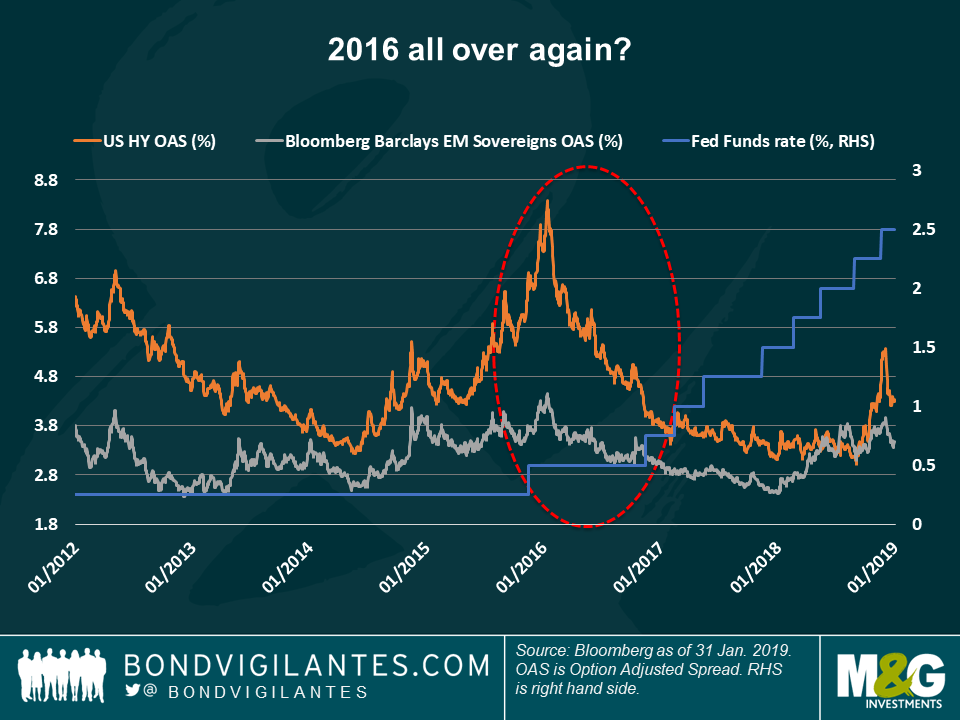
Markets beat the Fed – again: Over the past five years, investors have challenged the Fed’s optimistic growth and inflation forecasts, pricing in a much lower probability of monetary tightening than the central bank. Every year they have been right;, US inflation has failed to gain real traction and as last year’s tax cut-fuelled growth is starting to wear off. This is not the first time that the Fed backtracks on its plans: in 2016, Yellen was planning a few hikes after lifting interest rates in December 2015 – the first hike since 2006. The Fed, however, had to shift gears as the Brexit referendum, plunging oil prices, tensions around the liquidity of a major European bank and a slowdown in China threatened global growth and kept inflation subdued. The same pattern seems to be now at play: low energy prices, a slowdown in China and tensions in Europe (still Brexit). Investors were quick yesterday to snap up risk assets, given their reaction to a Fed-on-hold in 2016: as seen in the chart, HY spreads tightened by 400 bps in 2016, while the premium that investors demand to hold EM sovereign debt also dropped. Spread levels are lower now, but some investors believe that the higher coupon typically offered by risk assets could deliver positive total returns in the absence of any price drop derived from a rising base rate.
HY: Fixed or Floating? Global floating rate HY debt performed better than fixed-rate HY over the past six trading days as some investors were still counting on the Fed to hike rates this year. Whether this will now change following Wednesday’s statement is yet to be seen, as plenty of challenges remain – geopolitical tensions or an escalation of global trade wars could lead to higher rates, an environment in which floating debt typically outperforms. Investors might also choose the lower-beta floating rate market if the economy deteriorates more than expected. For an analysis of the two assets classes and a simulation of how each responds to interest rate and spread changes, don’t miss M&G fund manager James Tomlins’ insightful blog: High Yield in 2019 – floating or fixed?
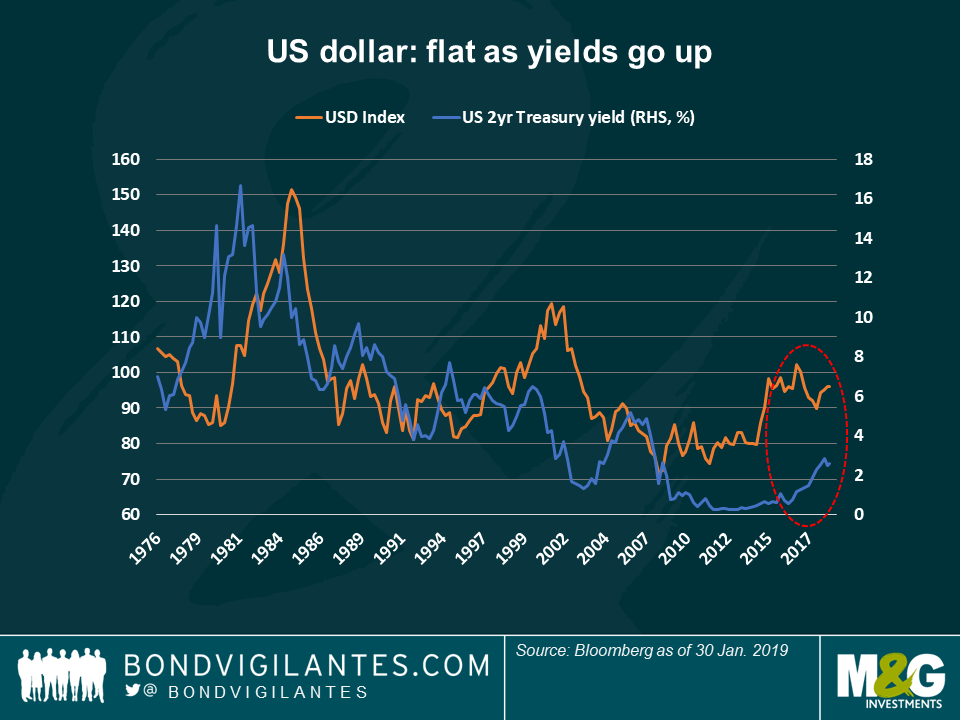
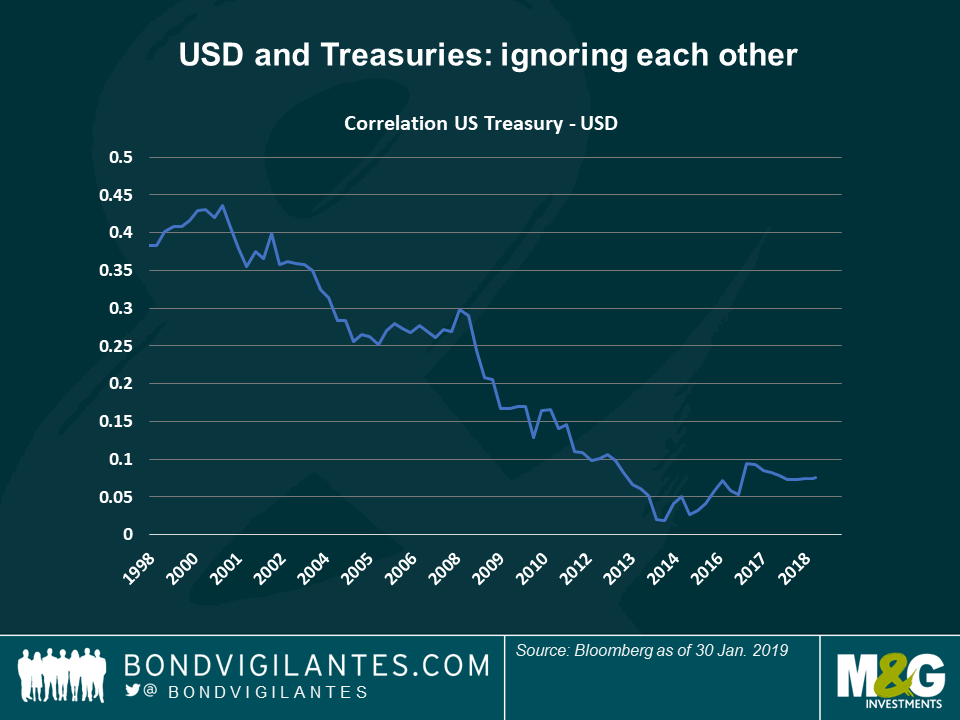
US dollar and US yields – parting ways: The correlation between the US dollar and 2-year Treasury yields has plunged to almost meaningless levels, after being at a stronger 0.45 (out of a maximum of 1) in the early 2000s – it has declined ever since. As seen in the first chart, the relationship between the two seems to have broken down over the past three years, as 2-year Treasury yields (blue line) have risen, reflecting strong economic growth, but the dollar (orange line) has not matched this move, remaining relatively around the same level. The US currency has failed to mirror the improving domestic economy, dragged down by growing fiscal and external deficits and also as China’s renminbi is challenging the greenback’s world supremacy status. Willing to internationalise its currency, China is encouraging other countries to write commodity contracts in renminbi and also lending large amounts to Asian and African countries in its currency. Some investors argue this challenge will still take years to materialise, while others focus on the lower demand for US assets from China and Japan, whose holdings of US Treasuries are in decline given the presently high hedging costs (a consequence of the big interest rate differential). If the US dollar, largely determined by foreign demand, is not matching US economic moves – does this mean that the rest of the world is less responsive to what is happening in the US?
European inflation expectations – party pooper: In the midst of January’s risk-on optimism, the one indicator that keeps falling is European inflation expectations, which dropped to 1.495% on Wednesday, the lowest level since 2016. European economic data remains dismal, with Germany’s economic ministry cutting the country’s growth forecast for this year to 1.0%, down from a previous 1.8%. With France’s economy challenged by ongoing protests, Italy’s protracted fight with Brussels over its budget deficit, and the possibility of a disorderly Brexit still on the cards, few investors seem to be betting on European growth. Four years after the European Central Bank launched its multi-billion euro monetary stimulus – the region’s inflation expectations are even lower than then.
When the presidents of the US, France and Britain cancel their trip to the World Economic Forum at Davos – the mecca of globalisation over the past two decades – to face domestic challenges, no wonder investors are worried about falling global trade, inward-looking policies and hence, lower global growth. This week’s data seems to vindicate such fears: US-China trade tensions escalated on speculation that a meeting had been cancelled; China posted 2018 growth of 6.6%, the slowest pace in almost three decades; US housing data was dismal and Germany’s Zew survey of economic growth prospects hit a four-year low. The International Monetary Fund (IMF), which has warned for months that less trade could hit economies, cut again its global growth forecast for 2019 to 3.5%, down from a previous 3.7%. The reduction was mostly due to slower growth in Germany and Italy, and a deeper-than-expected contraction in Turkey. The IMF kept its US growth forecast for this year at 2.5%.
Against this backdrop, and the market sell-off late last year, central banks are sending dovish messages, especially the US Federal Reserve (Fed). Over the past five trading days, the anticipation of lower or at least stable rates helped fuel risk assets, especially US Investment Grade (IG) companies, which particularly suffered in 2018 due to massive supply and deteriorating credit quality. High Yield (HY) spreads continued to tighten this week, taking their year-to-date gain to 3.7%, more than offsetting their 2018 loss of 2%. Emerging Markets (EMs) fell behind this week, after a very strong start to the year and as the US dollar gained against most developed and developing currencies, reflecting the US’s better growth prospects. US inflation expectations, on a downward spiral since October, have recovered in January after the Fed signalled a potential halt in its rate rising cycle, a move that may generate inflation. Also underpinning inflation expectations, oil surged to $53 per barrel, up from $45 at the beginning of the year.
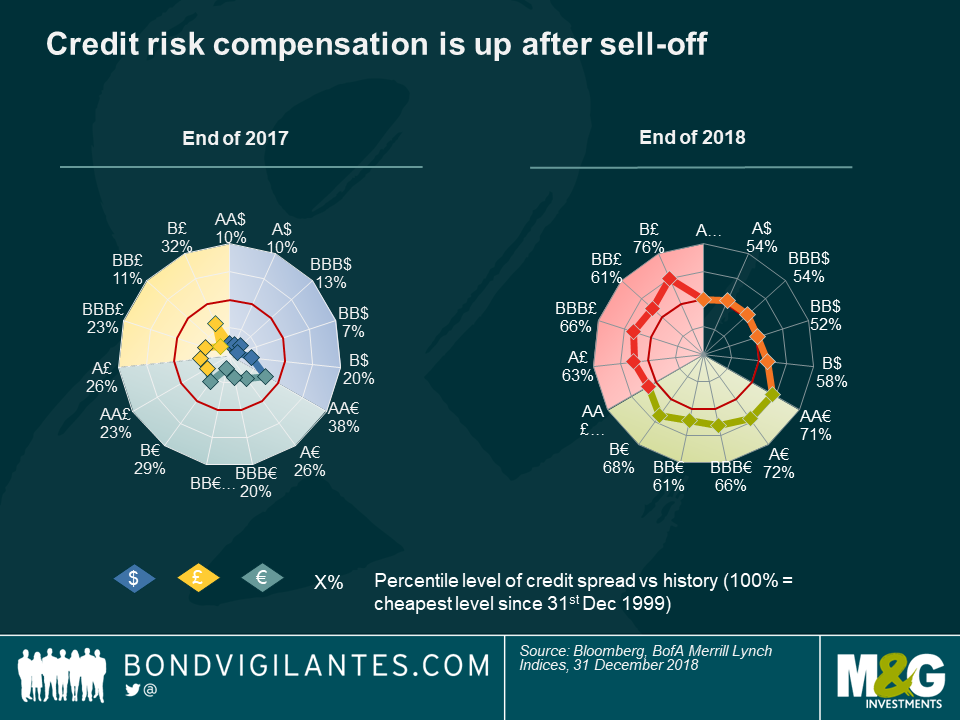
Credit – bargains after the sell-off? The sharp rise in global credit spreads last year has brought yields to a level that some investors say are high enough to compensate for the risk taken. As seen in the chart below, developed by M&G’s Fixed Income Investment Specialist team, leading global credit classes were trading below the mean level of a 20-year range (red circle) at the end of 2017. One year and a big sell-off later, only US credit is right at that 50% level, while sterling and euro-denominated corporate debt is trading closer to their cheapest level since 1999. The cheapest of all is Single-B rated pound debt (considered HY), which trades only 25% below its lowest price over 20 years, hit by Brexit concerns and by gloomy European growth forecasts. This outlook is also weighing on European credit – as seen by green line expanding further out in the right-hand chart. Lower valuations mean that investors have a bigger cushion before losing money from the credit component of the bond: for instance, for A-rated euro debt, which has a spread of 123 basis points (bps) over the risk-free rate and a spread duration (sensitivity to spread changes) of 5.12 years, the spread would need to widen by a further 62 bps before investors lose money (again, on the credit component of the bond). Such a move would take the spread to 185 bps, a level that has only been breached twice over the past 20 years: during the 2007-2008 financial crisis and during the European sovereign debt crisis in 2010-12.
Pound & UK economy – defying gravity: At the height of the Brexit uncertainty, when Britain’s scheduled departure from the EU is barely two months away and still there is no plan, the country posted some of its strongest data of recent times: unemployment dropped to 4%, more than expected and the lowest since Abba and The Bee Gees topped UK the charts (1975). Wages also rose, as the labour market tightens, and sterling rallied against a rising US dollar – it is up 2.27% so far this year, making it the top performing G10 currency against the greenback. The optimism comes as investors are pricing in less chances of a disorderly Brexit or other alternatives, such as a general election or a second referendum. UK linkers, however, didn’t join the optimism, as their 3.6% drop over the past five trading days makes them the worst-performing Fixed Income asset class of the 100 tracked by Bond Vigilantes Weekly: the House of Lords proposed changing inflation linked bonds’ reference index to one that tends to be a bit lower, leaving investors less protected. For more details, don’t miss M&G fund manager Ben Lord’s “The war of the indices: Which inflation measure to use?” post.
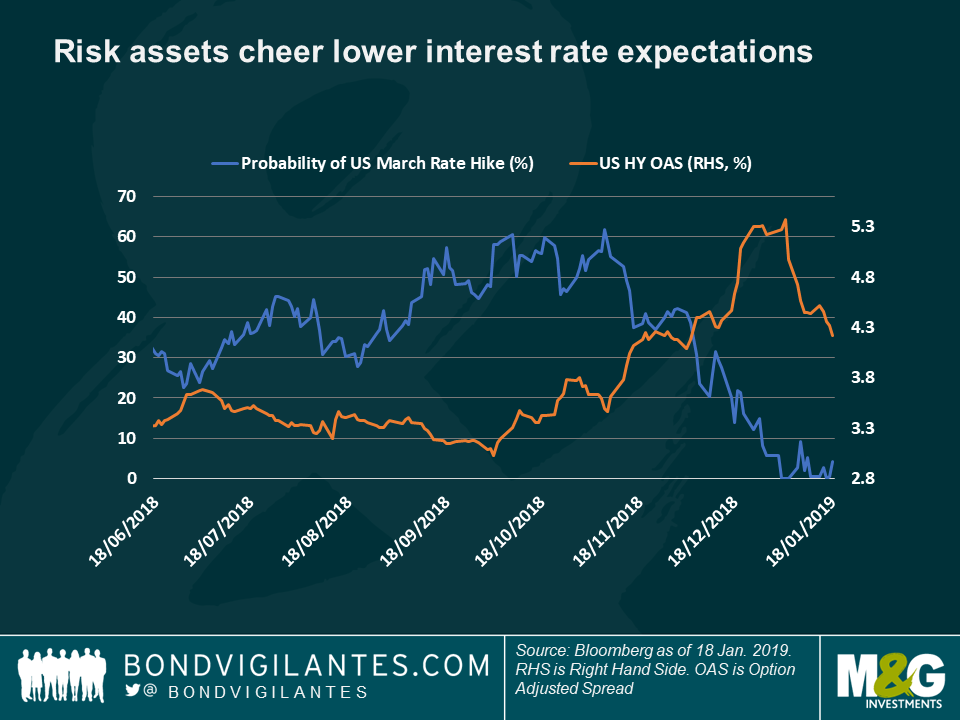
US rate hike forecasts – Fed on hold? Market-implied chances that the Fed will raise rates in March have plunged to meagre levels, down from more than 60% about two months ago. Fed officials have publicly recognised they are considering a halt in their interest rate rising cycle, following lukewarm economic data, protracted low inflation and the severe market sell-off in November and December last year, something that can hit consumer spending given the high degree of ownership of financial assets by US consumers. The ongoing month-long US government shutdown is also expected to hinder activity. As a result, corporate bonds are enjoying a strong January, on hopes that their positive return on invested capital will continue to be above borrowing costs, keeping their investments plans profitable. According to economic forecasts, US capital investment is expected to grow by 3.7% this year, more than any other Gross Domestic Product (GDP) component. As seen in the chart, US High Yield spreads have tightened in January, matching the drop in rate hike expectations.
Europe’s inflation expectations – back to square 1? Just as the European Central Bank (ECB) is preparing to withdraw its multi-billion euro QE support measures, inflation expectations have plunged, a reflection of the region’s dismal prospects: the IMF said earlier this week that lower European growth would drag down the global economy, especially due to the slowdown in Germany. Europe’s economic engine is being hit by soft private consumption and weak industrial production following the introduction of revised auto emission standards. Italy also faces weak domestic demand and higher borrowing costs, while French growth is being challenged by the ongoing “yellow vest” protests. The ECB’s favourite inflation expectations measure, the 5-year/5-year euro inflation swap rate, has dropped to 1.53%, the lowest level since June 2017, and about the same level it had in March 2015, when the ECB unveiled its stimulus programme.
Although world markets depend more on Fedspeak and China than on British politics, when the UK House speaker announced (in traditional centuries-old fashion) that the “noes” opposing the government’s Brexit plan had won – inadvertently, he helped reduce sugar levels in Europe. Investors’ interpretation that a hard or disorderly departure from the EU is now less likely strengthened the pound and lifted gilt yields – the latter, on lower safe-haven, chaos-escaping demand. Britain’s relief rally capped a strong start to the year, with more than 90 out of 100 Fixed Income asset classes tracked by Panoramic Weekly delivering positive returns. Only long US Treasury bonds and traditionally rock-solid assets such as Swiss and Singapore sovereigns have lost money to investors so far this year – less likely as they are to join a cheerful party.
In the US, the ongoing government shutdown, lukewarm economic data and mixed bank earnings vindicated the recent dovish tone of the US Federal Reserve (Fed), dragging down future rate projections even more: the market-implied probability of a US rate hike in March has now plunged to 0.5%, down from 41% in early December. This year’s oil rally and China’s reassurance of its economic stimulus plans also helped underpin risk assets: Russian, Nigerian and Mexican bonds are up by more than 4.2% in 2019, while US High Yield spreads continued to tighten: after spiking by almost 1.5% in a dismal December, they are now back down to 446 basis points (bps), their level in mid-December. News from Europe were not as positive: gloomy German data reduced inflation expectations at the same time that China posted a record low current account surplus, confirming that lower Asian appetite is hurting Europe’s industrial bastion (more below).
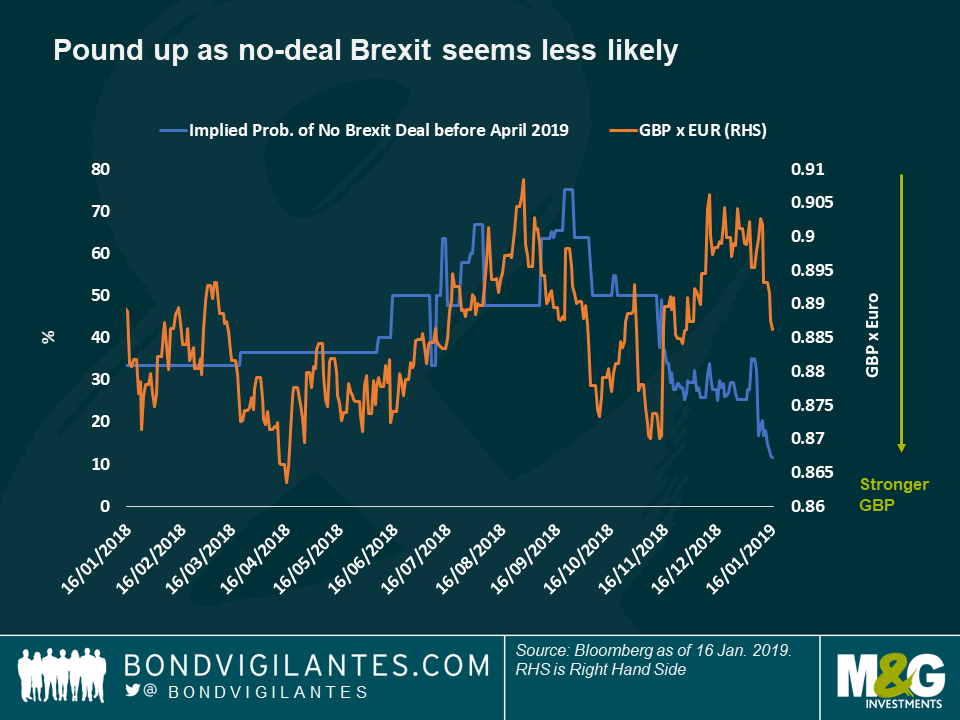
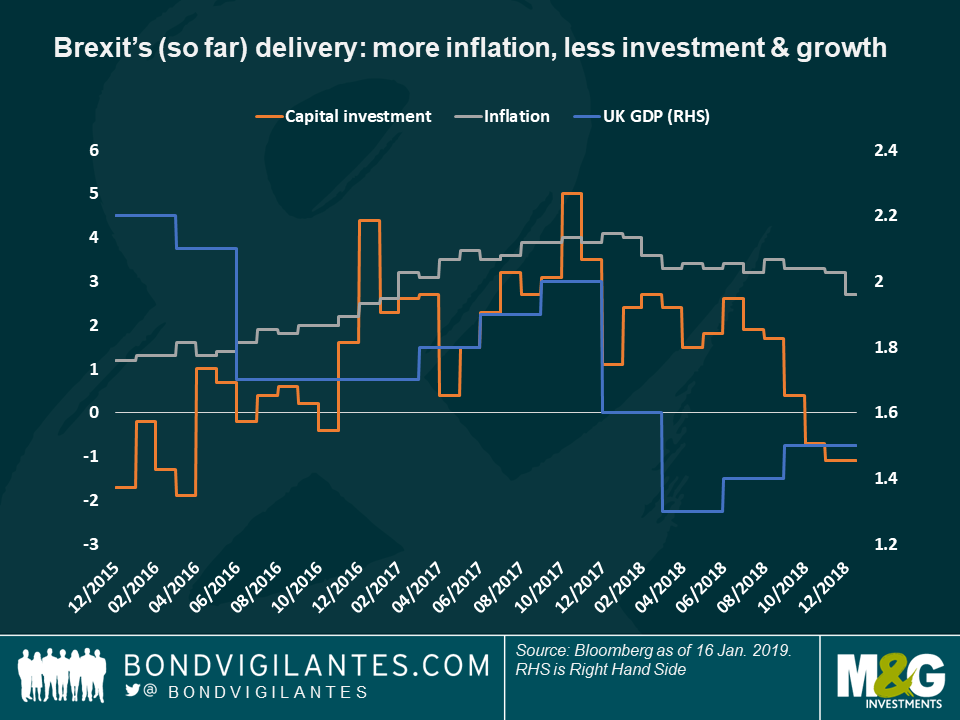
Sterling – avoiding chaos: A lower likelihood of food shortages and collapsed roads brought relief to sterling as investors started ruling out a sudden and unorganised EU departure. While many options are still open (general election, second referendum, even no Brexit at all), the pound strengthened to 1.286 per US dollar, the highest since November. The level, however, is still 13% below its price just before the 2016 referendum, when it crashed 20% on prospects of higher inflation and lower growth in the country. As seen in the first chart, sterling’s value has been largely driven by Brexit politics over the past two years – only diverging just before Christmas, when the crucial Parliament vote was delayed, finally taking place on Tuesday. While the government and Parliament have spent more than 2 years debating on Brexit execution, growth and investment have dropped, while inflation has gone up (second chart). At lease, Britons have one reason to cheer: the market-implied probability of a rate hike in March has dropped to 3%, down from 43% in October last year, mainly due to falling oil prices. December inflation rose by 2.1% from a year earlier, the lowest level in two years.
Argentina – see who’s rising: A history of defaults, an ongoing IMF programme and a decade-long legal battle with funds trying to recoup their money are not deterring investors from believing in Argentina again: the Latin American country’s bonds have gained 7.5% so far this year, the best-performing mark among the 100 Fixed Income asset classes tracked. The central bank has been the first among world leading countries to move this year – it is slowly cutting down the reference Leliq rate, now at 57.4%, down from a peak of 73% reached in October, at the height of the country’s crisis. Engulfed in a recession and under a stringent IMF programme, President Macri is trying to bring the country back to normality, especially ahead of this year’s general election, scheduled for Oct. 27. Read more about this year’s EM elections, and other factors affecting the asset class this year, in Claudia Calich’s recent blog: “EMs: 5 key issues to watch in 2019.”
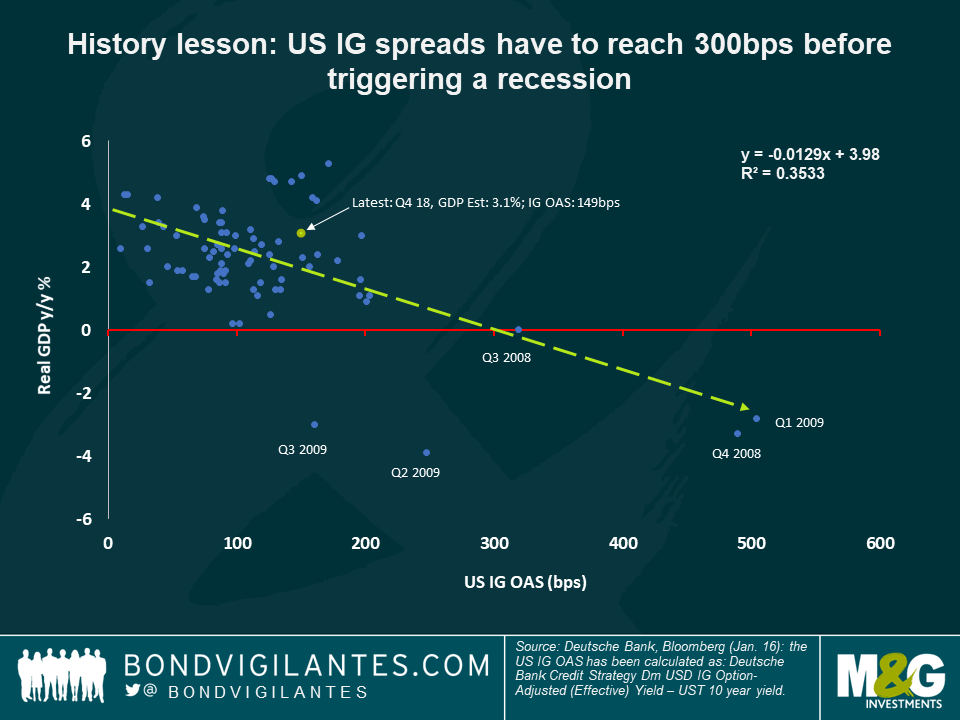
Probability of US recession? The Fed is becoming more dovish, interest rate hikes and inflation expectations are plunging and the New York Fed’s probability of recession index has climbed to 21%, the highest since 2008 – yet, credit spreads seem to tell a different story: according to Deutsche Bank Chief International Economist Torsten Slok, the premium that investors demand to hold US Investment Grade-rated companies has to reach 300 bps to trigger a recession (as seen on Slok’s regression chart below). This is well above the present level of 144 bps and not too far from a 30-year average of 134 bps. According to Slok, while manufacturing data points towards a gloomy scenario, other factors could still underpin the US economy or at least protect it from falling into recession – mainly the recent stabilisation of oil and equity prices, and the possibility that the US-China trade war might have already peaked. Capital expenditure is still projected to sustain growth over the next two years, as the Return on Invested Capital is still above corporate borrowing costs. According to market prices, the Fed will be on hold this year, backtracking from its present plans to hike rates twice more.
China’s current account and Germany’s economy – no coincidence: Germany’s economic growth slowed down to 1.5% last year, the weakest in five years, mostly due to lower global demand and disruption in its car industry, hit by new clean regulation. At the same time, China’s current account fell to a meagre 0.4% of GDP, a 20 year-low and a reflection of the country’s efforts to focus more on internal demand than on cheap exports. German carmakers and other industrialists are suffering from the shift, only exacerbated by last year’s increased trade wars. German woes helped drag down Europe’s general economic sentiment, which reached in December the lowest level in about two years.
Goldilocks, one of investors’ favourite economic scenarios, seems to have returned in the new year after almost vanishing in 2018: a strong US jobs report and dovish comments from US Federal Reserve (Fed) chair Jerome Powell have reinstated the not-too-hot, not-too-cold environment that combines relatively low rates and good-enough economic growth – supporting risk assets. US High Yield spreads, for instance, have rallied 80 basis points (bps) so far this year, after widening more than 1% in a dark December. Equities have soared.
Optimism has been mainly triggered by Powell, who said on Friday that the Fed would be patient on its rate hiking path as inflation remains muted. Markets reacted with force: expectations of a March Fed hike have now plunged to 5%, down from 41% one month ago, while inflation expectations and the dollar fell. These tailwinds favoured Emerging Markets and their currencies, which rallied also on the back of more Chinese monetary policy easing measures, and despite soft data from the world’s second-largest economy: China’s December producer and consumer inflation both came in below expectations. In Europe, disappointing German data held the euro, which remained flat against a falling dollar.
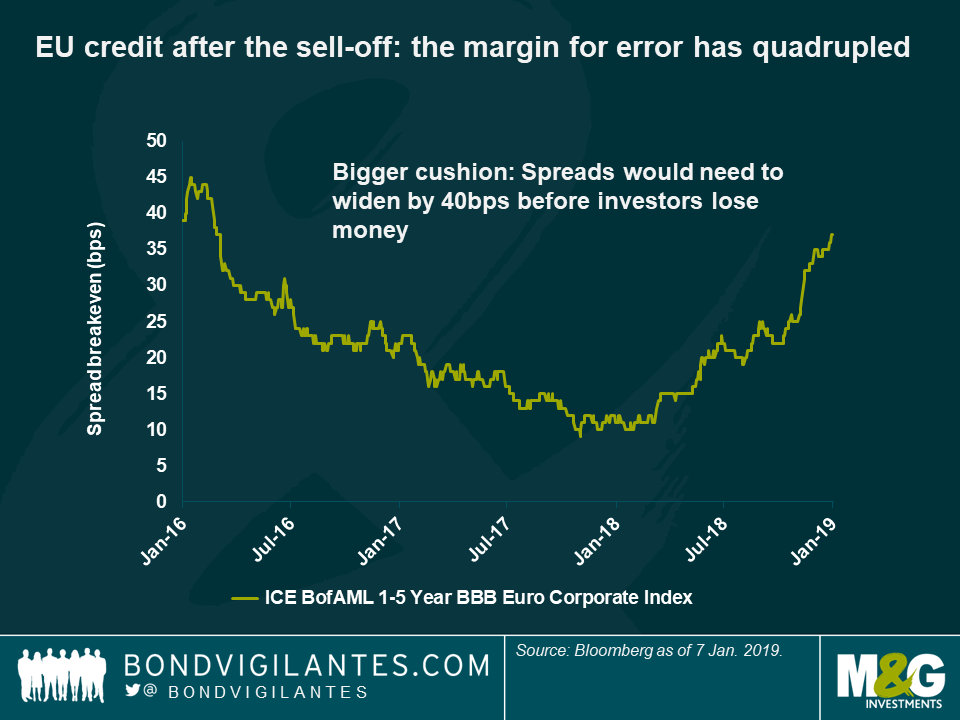
Cushions – credit sell-off increases margin for error: Despite the pain, at least the recent credit market sell-off has left investors with a bigger protective cushion before losing money: according to M&G fund manager Wolfgang Bauer, spreads of short-maturity, European Investment Grade corporate bonds would need to widen by 40 basis points (bps) this year before dragging investors into negative returns. This cushion, calculated as the index’s OAS/Libor spread divided by its spread duration, was below 10bps barely one year ago, a level which practically priced in perfection. As seen in the chart, the cushion has been growing as markets fell, especially following the Italian election in May, which raised fears about the future of the EU. This margin has now reached the highest level in about two years and is about four times bigger than a year ago. According to Wolfgang though, European corporate bonds are still sensitive to political volatility and to ample supply (usually a negative for bond prices). European data has also been disappointing, although economic growth is still expected to rise by 1.6% this year and by 1.5% in 2020 (down from 1.9% in 2018). Don’t miss Wolfgang’s credit review: Self-check: how did we do in our 2018 predictions?
US dollar and oil prices – perplexing the Fed: The strong correlation between oil prices and the US dollar over the past decade has surprised many investors – not least the Fed. In its recent blog “The perplexing co-movement of the dollar and oil prices,” the US central bank questions the logic behind the dollar’s weakness against the euro when oil prices rise. According to the bloggers, a 10% increase in oil prices is associated with a 1.5% depreciation of the dollar against the euro, something which not always makes sense as oil prices are often driven by Asian demand and Middle East output. Why would this affect the USD/Euro exchange rate? One explanation, the Fed argues, is that higher oil prices lower expected US output relative to Europe’s, dragging the greenback lower. This happens as Europe tends to tax gasoline more heavily, making European consumers less sensitive to petrol prices. However, the Fed admits it is hard to imagine that the levels of congestion on European roads do actually drive the USD/Euro exchange rate. The central bank leaves this issue as an open question – at the same time that oil prices are rising, and the dollar, falling.
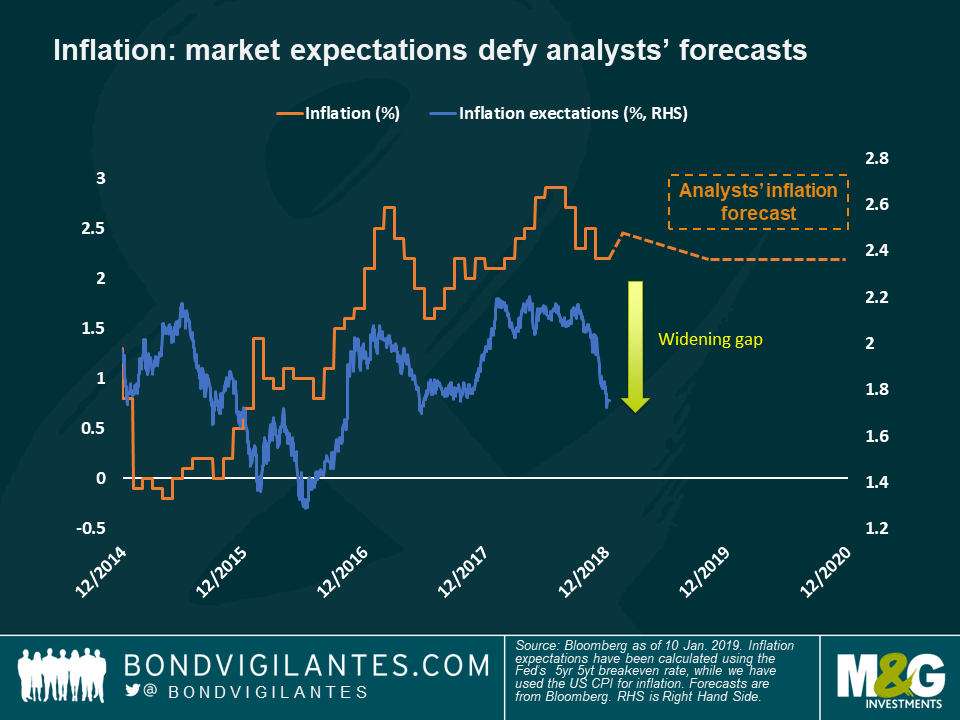
US inflation expectations – Powelled: Fed chair Powell’s recent reassurance that the central bank remains data-dependent, watchful of market reactions and not blind to inflation’s failure to significantly pick up, threw a bucket of cold water over US inflation expectations. Also challenged by the recent drop in oil prices, the Fed’s favourite inflation expectations gauge – the five-year forward breakeven rate (blue line) – has plunged to 1.75%, the lowest level since June 2017. The figure is substantially below the country’s consumer inflation forecasts (dotted orange line), a mean average of multiple analysts’ quotes, currently expecting inflation to have reached 2.4% in 2018, slowing down to 2.2% in both 2019 and 2020. As seen in the chart, the increasing difference between the two magnitudes breaks a close correlation over the years: some observers say this is because analysts’ inflation forecasts are unrealistic, while others say that breakeven rates, or market expectations, are too pessimistic as the US economy is still expected to deliver economic growth of 2.6% this year and 1.9%, next. As ever, mis-pricing are what active investors look for – as long as they are right.
Germany – in recession? Ten-year German bund yields are trading again at 0.2%, having reached a 2-year low of 0.15% at the beginning of the year. This time, though, the yield drop may come for all the wrong reasons rather than because of safe-haven demand: industrial production fell for a third straight month in November, bringing the annualized figure to a negative 4.7%, the lowest since 2009, and raising concerns about Europe’s strongest economy slipping into recession. German industry has been hit, among other things, by reduced global trade and a slowdown in China – Chinese car sales fell by 6% in 2018.
The new year has started with a blunt reminder of probably everything that investors wanted to forget over the holiday season: economic data is worsening while the oil price continues to fall, dragging down equities and the most equity-like fixed income asset classes. Traditional safe-havens continue to rally, as they did in 2018.
The year left behind ended far worse than it started: after a strong-growth 2017, where most fixed income sectors delivered positive returns, last year’s early hopes quickly sank with the escalation of the US-China trade war and the Italian elections in May, which raised questions about the future of the European Union (EU). Fears of a hard Brexit also weighed on the continent’s economic prospects, lifting credit spreads above those in the US for the first time in years. China continued its slowdown, while in the US, optimism started to fade as interest rates rose, economic data disappointed and oil plunged to less than $50 per barrel amid forecasts of weak demand. US corporate earnings projections were also reduced as the effects of the recent tax cuts started to decline. The world benchmark US 10-year Treasury yield, which reached a 7-year high of 3.2% last year, changed gear after the Democrats won control of the House of Representatives in the November mid-term elections. Investors believed that their victory reduces the chances of further tax incentives from President Trump. The 10-yr Treasury yield has been on a continuous slide since, ending 2018 at 2.66%.
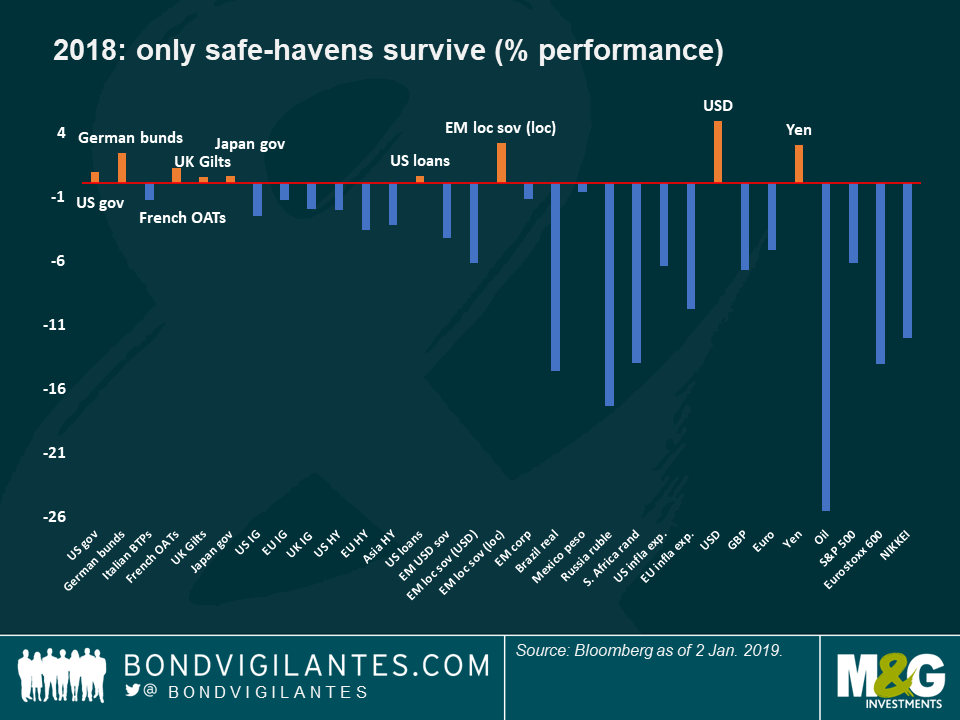
Despite the pessimism, almost one third of the 100 fixed income asset classes tracked by Panoramic Weekly delivered positive returns last year, led by traditional safe-havens, such as German bunds and US Treasuries. With global growth slowing down and global debt reaching a whopping 225% of world GDP, investors are betting some central banks may have to rein in their rate hike projections – offering more support to bond prices. US Federal Reserve Chairman Jerome Powell already did in December – the Fed now sees 2 rate hikes this year, instead of 3. The M&G Panoramic Weekly team wishes you a very happy new year.
Safe-havens – the best of times in the worst of times: US Treasuries, European government bonds and Japan’s sovereign debt did in 2018 what they usually do: deliver positive returns, rain or shine. While corporate debt markets and developing nations suffered from higher interest rates, a stronger dollar, the ongoing trade wars and lower global economic growth, traditional safe-havens remained solid. Treasuries have only posted negative returns in 2 of the past 18 years (2009 and 2013), while European and Japanese government bonds have only missed 1 year of positive returns (2006 and 2003, respectively), over the same period. Sovereign bonds have been favoured by protracted global low inflation, a backdrop that may continue going forward given the recent plunge in oil prices. Weaker growth and rising global debt may also refrain central banks from tighter monetary policies: out of 19 major economic areas, 5 are projecting lower rates in 3 years’ time (the US, Mexico, the Czech Republic, Japan and Korea), compared to none barely 2 months ago, according to Bloomberg data. In terms of currencies, safe-havens have also outperformed, mainly the US dollar and the yen. As Dickens would have put it, for safe-havens, it was (is?) the best of times, it was (is) the worst of times; it was the age of wisdom, it was the age of foolishness…
China government bonds and loose policy – odd one out: China’s USD-denominated sovereign debt returned 3.8% to investors in 2018, the third best performer among the 100 fixed income asset classes tracked by Panoramic Weekly. The rise comes despite a slowdown in economic growth, now down to an annualised pace of 6.5%, from 6.9% last year. The country’s manufacturing PMI dropped to 49.4 in December, the weakest since 2016 and below the 50 level that marks a contraction. Yet, the Chinese government’s stimulus policies, including cuts in the banks’ reserve requirements, continue to support the economy and the bond market. Still mostly in the hands of local investors, Chinese debt is increasingly available to foreign holders via the Bond Connect programme, and may be more in demand after it is included in some Bloomberg Barclays benchmark indices from April this year. In the present global rate rising environment, investors welcome a country with an overall easing policy.
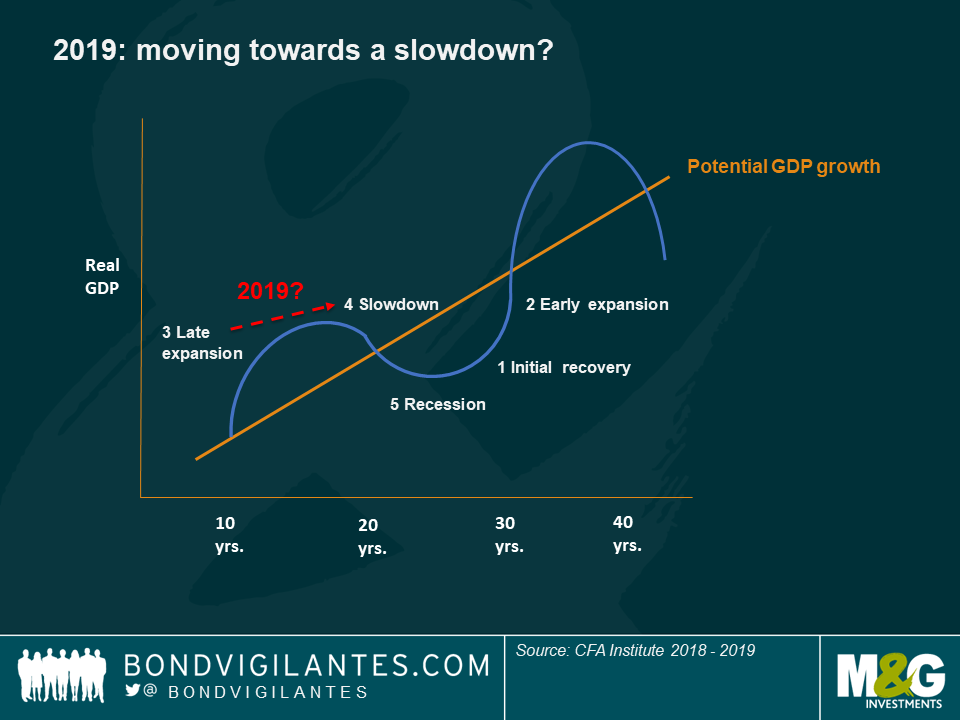
Business cycle – down-sloping? With the last recession now a decade ago and economic theory suggesting that cycles tend to last about 10 years, investors are understandably concerned – hence their preference for safe-havens over risk assets. But more than timing, the nervousness comes amid other signals: during the late expansion phase of a business cycle, economic growth tends to be above the long-term trend growth, but the pace starts to slow down. In the US, for instance, growth is expected to drop to 2.6% this year, and to 1.9% in 2020, down from an expected 2.9% in 2018. This “late expansion” phase is also characterised by restrictive policies (which we are seeing around the world as central banks move from Quantitative Easing to Quantitative Tightening), and by rising inflation (in the US, inflation is expected to rise to 2.4% in 2018, up from 2.1% in 2017). Interest rates are usually higher (the 2-year Treasury yield, the de facto world’s discount rate, leapt from 1.8% to 2.49% in 2018), bringing volatility to equity prices (the S&P 500 index lost 6.2% last year). If this “late expansion” narrative applied well in 2018, the new year might bring us the following “slowdown” phase, where we usually see: slower growth (already forecasted), peaking consumer confidence (this is a lagging indicator as consumers typically need to see weak data before holding up purchases), a cooling off of restrictive policies (Fed chair Powell could have already signalled this in his dovish December speak), as well as higher inflation (also in the cards in the US). In this environment, long term bond yields usually drop as investors discount the slowdown, while equities suffer from the anticipation of a future recession, which would be the next stop. As usual, opinions vary: while the Fed sees 2 rate hikes next year, and further tightening in 2020, markets are pricing in no hikes at all this year, and cuts afterwards. Nobody knows what the future holds, but over the past few years, markets have been better predictors than then Fed.
EMs – tough year: Emerging Markets (EMs) USD-denominated sovereign debt fell 4.3% last year, the third annual loss over the past 18 years (the others being in 2013 and 2008). The period also includes ten years of double-digit positive returns, as the asset class benefited from strong global growth in the early 2000s, while remained relatively immune to the 2007-2008 financial crisis given its lower banking problems. But 2018 brought them a toxic mix of a rising dollar, falling oil prices (which hit oil-exporting EM heavyweights such as Brazil, Mexico and Russia), trade wars and idiosyncratic problems in Argentina and Turkey. All this hit African, Middle Eastern and Latin American countries the hardest, with Eastern Europe and Asia remaining more resilient. Some investors argue that the fate of EMs may change this year as the ‘twin deficits’ in the US may contain any dollar surge while global growth is forecast to stay positive, albeit unspectacular. Some also believe that with yields at 6.8%, the highest since 2009, risk might be compensated.
Despite big headlines and price swings, most fixed income asset classes ended the five-day period back where they started. This moderate, short-term mean-reversion reflects contradictory views and general confusion over the outcome of the US-China trade negotiations, Europe’s national deficits and Brexit. The world-benchmark 10-year Treasury yield has reflected this mood, dropping to 2.85%, down from 3% earlier this month, just as the US Federal Reserve (Fed) insists on a solid domestic economy and further rate hikes, and all while High Yield spreads have widened by more than 100 basis points since October. For more insight, don’t miss M&G’s Jim Leaviss annual outlook “Panopanic 2018,” and Laura Frost’s recent video: “Market contradictions.”
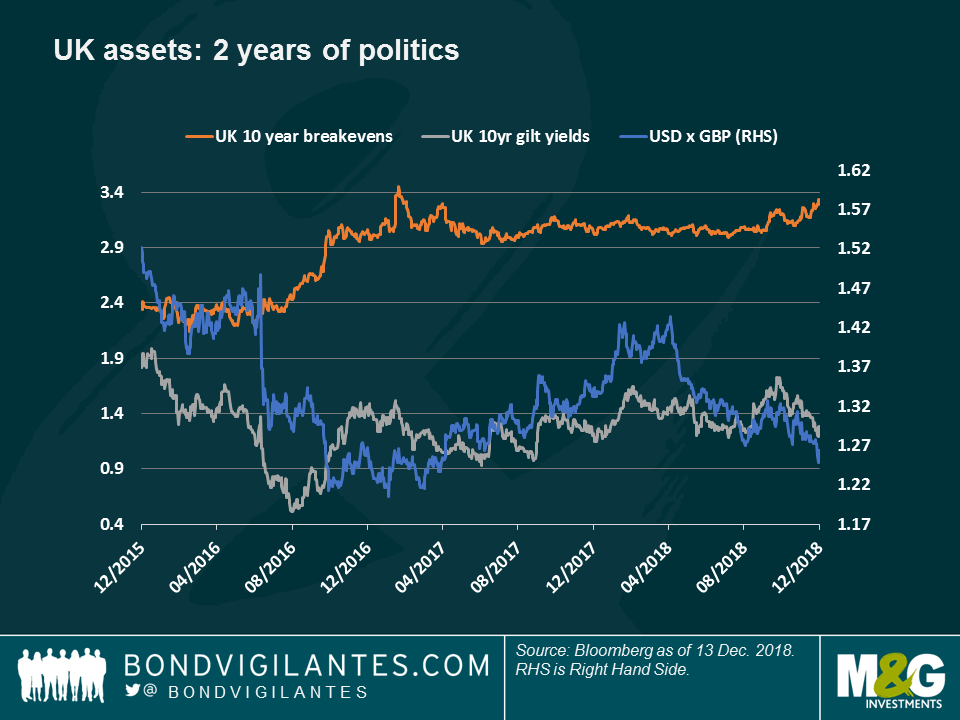
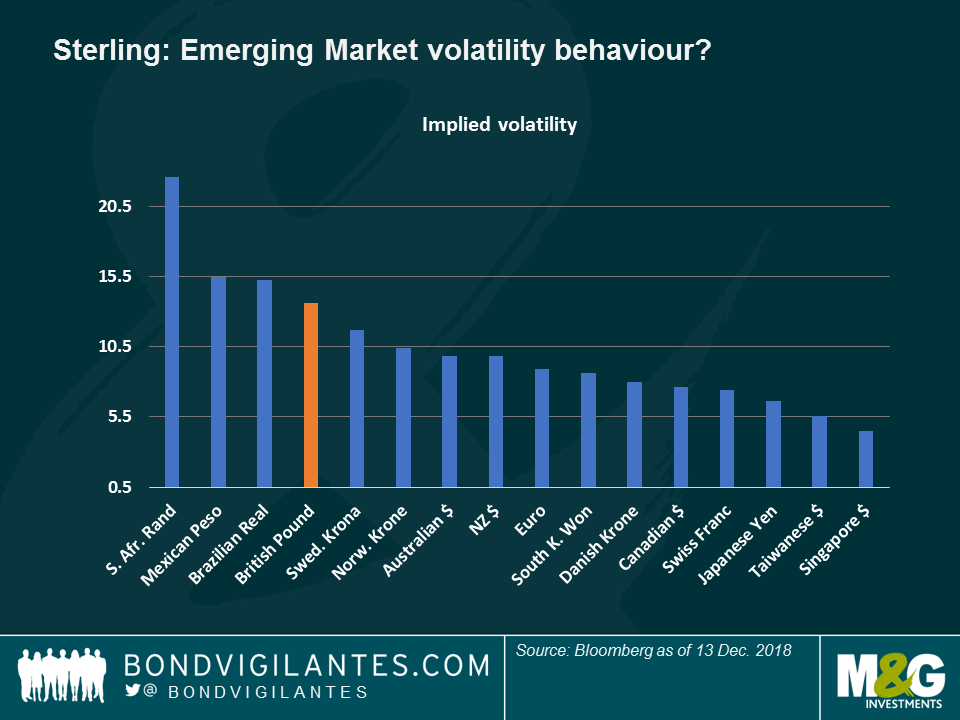
UK assets – Winter in Wonderland: UK gilts and breakeven rates, as well as sterling, have had a Winter in Wonderland-like roller-coaster ride in December that has left them barely where they were: back to square one. After two years of negotiations, and against some odds, UK Prime Minister Theresa May will spend Christmas at No. 10 Downing Street, having survived numerous challenges, including Wednesday’s Leadership contest from her own party. In reaction, the pound strengthened, and gilt yields rallied, both on market expectations that a disorderly exit from the EU is now less likely. Ten-year inflation expectations, which had spiked to an 18-month high of 3.3% just before the Leadership challenge, waned slightly. However, they are still running high (orange line in the chart) as a departure of the EU is expected to weaken the pound, making imports more expensive. Sterling volatility may not have quieter days ahead, either: as seen in the second chart, the British currency ranks before South Africa, Mexico and Brazil in terms of volatility, yet while offering a much lower carry: ten-year UK sovereign bonds yield 1.25% at present, below Brazil’s 5.1% and Mexico’s 4.6% (for 9-year bonds). As M&G fund manager Ben Lord recently said, Britain’s MP’s Christmas may be not be that quiet.
French spreads – shiny heights: The premium that investors demand to hold French government bonds over traditionally rock-solid German bunds spiked to 44 basis points earlier this week, the highest since last year’s national election, when fears of a far right-wing, Eurosceptic victory were running high. The recent spike followed riots in Paris, and across France, in which worker’s protests led President Macron to promise a higher minimum wage and to cut some taxes. Investors, though, were quick to reprice their premium on French debt as the country’s Budget Deficit is expected to spike to 3.4% of GDP, up from a previous estimate of 2.8% – dwarfing Italy’s expected 2% figure. Brussels may be a bigger challenge for Macron.
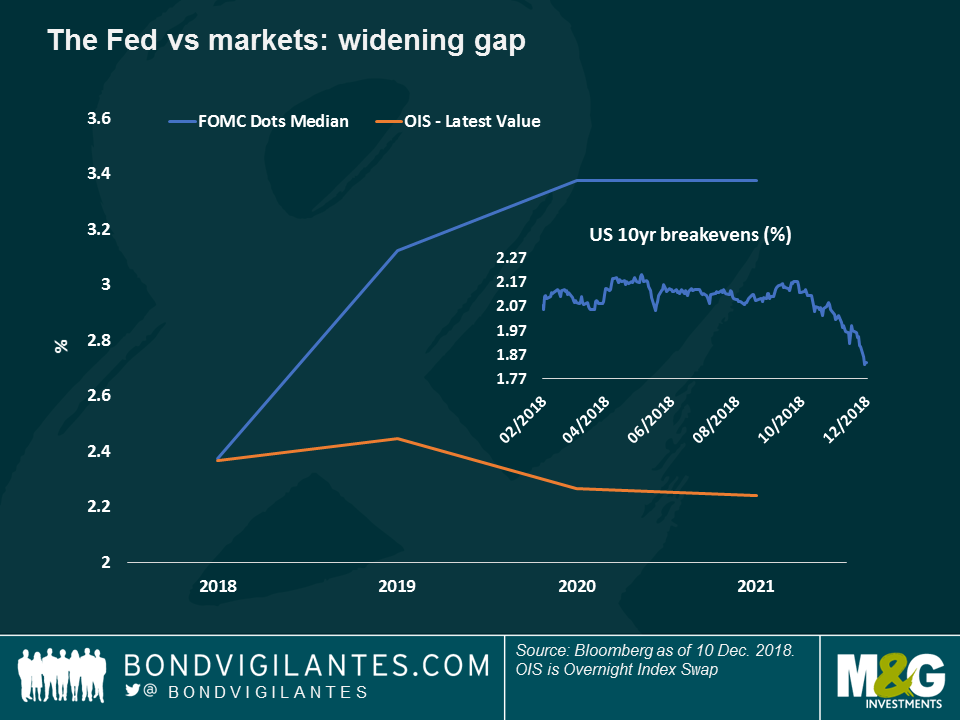
The Fed vs the markets – parting ways: The discrepancy about interest rate expectations between the Fed and the markets is only getting wider: while Fed officials see rates at 3.5% in 2021, the market-implied probability points to a much lower 2.5%, just one quarter-point rate hike above the present level. While Fed officials have sounded more dovish of late, their stance continues to be one of solid growth (2.9% this year), set to continue over the next two years, albeit at a slower pace (2.6% this year and 1.9% in 2020). Instead, markets seem to be more focused on inflation expectations, a key driver of Fed policy, especially since unemployment, at a 50-year low, is not a top worry. Inflation expectations, though, have plunged in the third quarter, down from 2.17% in early October to the present 1.83%, the lowest in more than one year. The plunge in oil prices has directly contributed to this drop, widening the wedge between Fed and market expectations. But it’s not all down to oil: investors are also questioning corporate earnings after the effect of this year’s tax cuts wane, at the same time that next year’s profit forecasts have been largely cut. The IMF has also reduced its global growth estimate, citing the ongoing trade wars. Over the past few years, markets’ predictions have tended to be more accurate than the Fed’s but, as ever, past performance is not an indicator of future outcomes.
India – high turnover at the central bank: The Indian rupee plunged 2.1% over the past five trading days, the worst Emerging Market (EM) currency performance against the US dollar, following Wednesday’s abrupt departure of central bank governor Urjit Patel. The appointment of Shaktikanta Das, the third central bank chief in as many years, has raised investors’ questions about the monetary authority’s independence, especially ahead of next year’s general election. The new chief, though, is expected to cut rates as inflation has slowed down to an annualised 2.3%, at the same time that India bears the highest real rates in Asia, at 4.2%, hindering growth.
Global bond markets rallied over the past five trading days as plunging oil prices, weak US data and disappointment over the real impact of a 90-day trade truce between the US and China led to a sharp flattening of the US yield curve, which is now only 12 basis points from inversion. The flattening intensified after US President Trump toned down his recent comments about the US-China trade agreement struck over the weekend in Buenos Aires. The appointment of Robert Lightizer, a renowned US trade hawk, to lead the next round of trade negotiations didn’t help either. The environment was further dampened by a global equity sell-off, disappointing PMI European data and violent, anti-austerity riots in Paris. Britain’s own troubles also intensified as the crucial Dec. 11 Parliamentary vote on Brexit approaches.
Only four of the 100 fixed income asset classes tracked by Panoramic Weekly failed to gain on the gloom, including US leveraged loans, which usually do well in a rate rising environment. The market-implied probability of a Federal Reserve rate hike next week fell to 74%, down from 80% last week. European high yield also failed to deliver positive returns, dragged down by Italy’s ongoing woes over its budget deficit. Long duration bonds fared best, given their higher sensitivity to interest rates: UK inflation-linked bonds soared 3.4% over the past five trading days, while 25-year Treasuries returned 2.7%. Doubts over US growth punished the dollar, fuelling a rally in Emerging Market (EM) sovereign bonds and currencies. EM currencies were also underpinned by further rate hikes in South Korea and Pakistan. Credit spreads mostly widened given the generally pessimistic tone, but the drop in the underlying sovereign base rate offset the fall, helping most corporate asset classes still deliver positive returns.
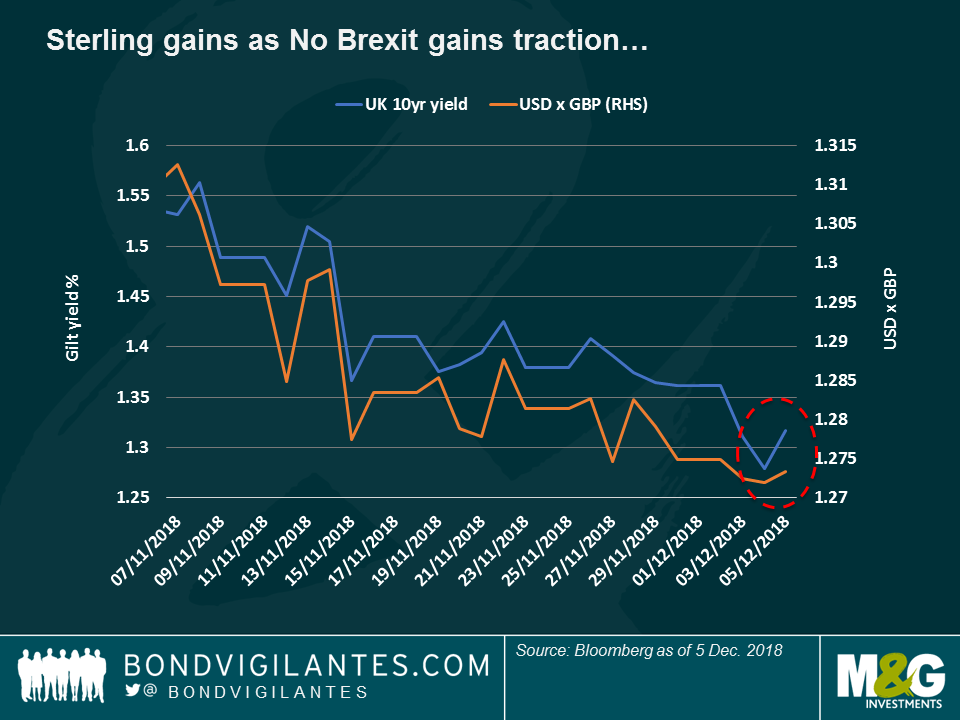
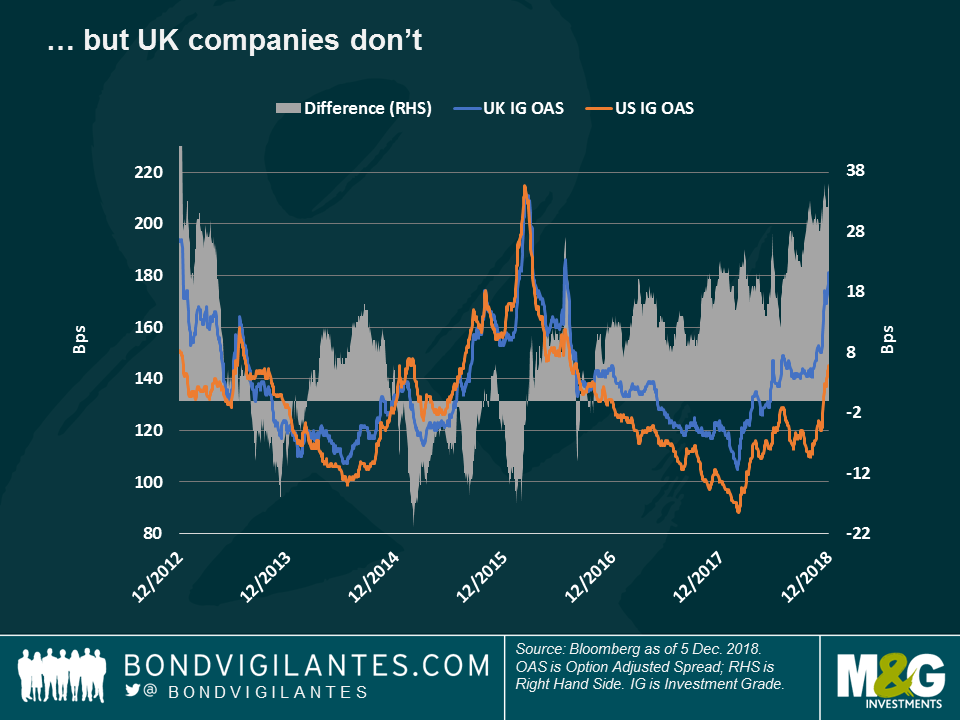
UK – to Brexit or not to Brexit: In truly Shakespearean dramatic style, the House of Commons pushed to increase its say in case Prime Minister Theresa May’s Brexit deal doesn’t pass the Dec. 11 vote in Parliament as widely expected. At the moment, potential outcomes remain wide open including: a Conservative leadership challenge, a general election, a second referendum on EU membership, a postponement of the decision to leave, and even a revocation of the agreement entirely. Financial markets interpreted developments as a sign that staying within the EU is an increasing possibility, something which fuelled a slight appreciation in the pound. As seen in the first chart, gilt yields also rose, on lower safe-haven demand. Inflation expectations slightly eased, as a stronger pound helps contain import price growth. UK companies, however, didn’t see any relief: the difference between the risk premium that investors demand to hold UK Investment Grade bonds relative to their US peers continued to widen, reaching 36 basis points (bps), the highest since 2012, at the height of the European sovereign debt crisis. After two tumultuous years of negotiations, at this stage only one thing seems certain – we haven’t seen it all yet.
EM yields – compensating for risk? EMs have had a tough 2018, mostly driven by fears of weaker global growth, a rising dollar and country-specific troubles in Argentina and Turkey. One of the asset class’s flagship indices, the JP Morgan gauge of EM sovereign US dollar-denominated debt (EMBI), has plunged 5% so far this year, also dragged down by the poor performance of oil-exporting countries, such as Brazil, Mexico and Venezuela. The price drop, however, has lifted the EMBI’s yield to 7%, the highest since the index was created in 2009 – a level at which some investors feel compensated for risk.
US yield curve – curving: Bond investors usually like curves because convexity enhances gains and reduces losses – but not everybody likes the curves that are on offer now: the difference between 10- and 2-year Treasury yields has plunged to a mere 11 basis points, the lowest since 2007 and nearing the inversion line – usually a sign of recession. As seen in the chart, curve inversions have often preceded recessions (grey bars), usually triggered by either an asset bubble burst (like the dot.com bubble in the early 2000s or the Mortgage-Backed Securities implosion in 2007), or by a succession of rate hikes, which damage growth. Some observers were expecting the 2-10 curve to eventually invert next year, although this week’s events might have brought such an outcome a bit closer: the 5-2 year curve has already inverted, having reached -0.967 basis points this week. Observers in this camp argue that the recent, sharp increase in the US Treasury 2-year rate, the world’s de facto discount rate, will most likely hit growth and reduce earnings. Other investors, however, believe that US growth and corporate earnings, albeit a bit slower, are still solid. According to consensus estimates, the US economy is set to grow by 2.9% this year, 2.6% next, and 1.9% in 2020.

US BBBs – Geee: The lowest-ranked credits among US Investment Grade (IG) corporate bonds continued to suffer from a decade of relentless size growth – and some specific stories: the spread over Treasuries that US BBB-rated companies have to pay spiked to 174 basis points (bps) on Wednesday, the highest in more than two years. The asset class has also been hit by mounting investor concerns over General Electric, the US industrial titan that has embarked on a deleveraging and asset sale programme in order to shore up its books – don’t miss Mario Eisenegger’s blog: Can General Electric ease the pain of BBBs?
If investors enjoyed a dream Goldilocks scenario in 2017 in which growth was hot enough to lift earnings but not too much to warrant sharp rate hikes, many expected 2018 to be more like the year of the bear, marked by a significant rate hiking cycle – until last week. US Fed chair Jerome Powell said the current policy rate is just below the non-accelerating rate of inflation – a sign that the central bank might slow down the rate-hiking path it outlined in October. Stocks soared and bond yields dropped, with the 10-year Treasury yield slightly dipping under 3% for the first time since September. Risk asset spreads, such as those of High Yield, tightened.
Powell’s dovish comments came as oil has shed $20 per barrel over the past two months to trade at just above $50, the lowest level in more than one year. US economic data has also disappointed (Housing, Industrial Production, Durable Goods Sales and Consumer Confidence) Recent mid-term election reverse for US president Trump makes further tax cuts more unlikely, which could weigh on growth. Last week, European PMIs also came in below expectations. The IMF warned about weakening global data and darker clouds looming, only one month after cutting its global growth forecast. At least, geopolitical tensions seemed to abate after the weekend’s G20 summit in Buenos Aires, in which Trump and China’s president Xi signed a trade war truce, which helped soften the US dollar, boosting Emerging Markets assets.
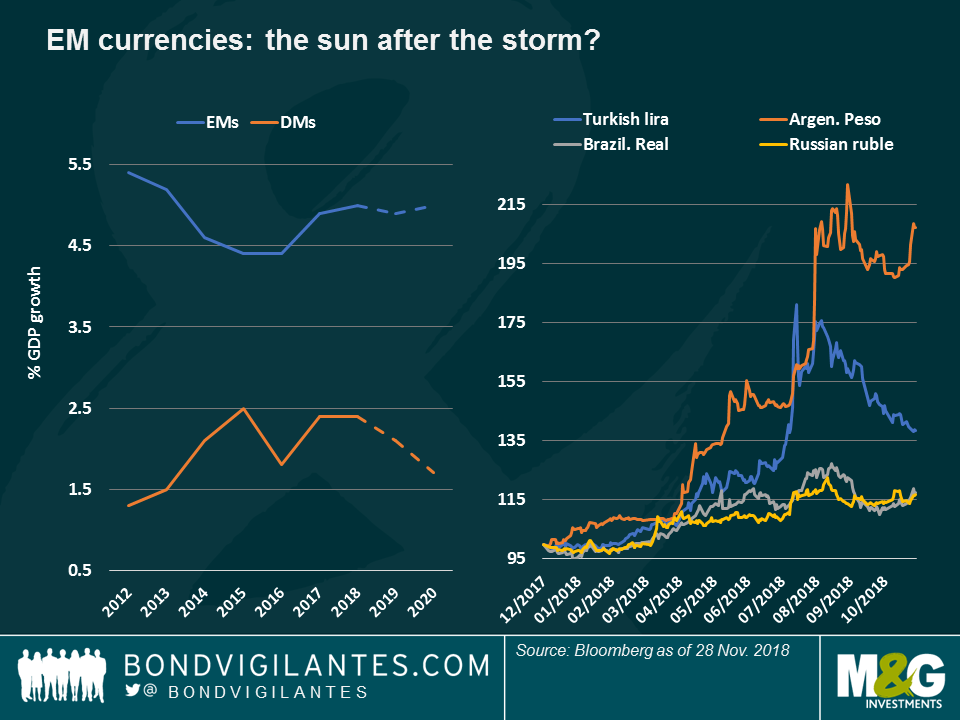
EM currencies – winter sun: Emerging Market (EM) currencies had a good November. Despite the recent global credit sell-off, locally-denominated EM sovereign bonds delivered a 1.6% return to investors in November, which increases to 2.2% when translated in to US dollars, given the currency appreciation. As seen in the chart, the Turkish lira (blue line) has performed strongly up 6.7% against the greenback so far this month, helping it recover about half of what it lost over the summer. Investors now seem less concerned about Turkey’s fundamentals especially given the plunging oil prices which are a relief for the country’s Current Account. India, another major oil importer, saw its currency soar 5% over the past month, especially as the US waived some sanctions on Iran so that the oil-producing nation could continue exporting. The South African rand, recently unfavoured by investors due to the country’s high Budget and Current Account deficits, also rallied after the central bank recently hiked rates to 6.75%, from 6.50%, and cut its inflation projections. After the summer storm in which Turkish and Argentinian uncertainty spread to other EMs investors seem to be looking back at fundamentals. As seen in the chart the growth outlook is far rosier for EMs than for Developed Markets.
Italy – last will be first: Still deep in the red so far this year, Italian government bonds occupy a surprising No. 1 position in the weekly return table of 100 Fixed Income asset classes. The gains, which reduce the year-to-date loss to 4.7%, come as the country’s government and the EU seem to be nearing an accord over Italy’s budget deficit. Since it was elected in May, the government has challenged Brussels’ fiscal discipline creating tensions that not only widened Italian government and corporate spreads but also had a negative impact on European assets overall. More optimism about an agreement has lifted this week’s returns of Europe’s High Yield indices where Italy has a 15% weight, more than any other nation.
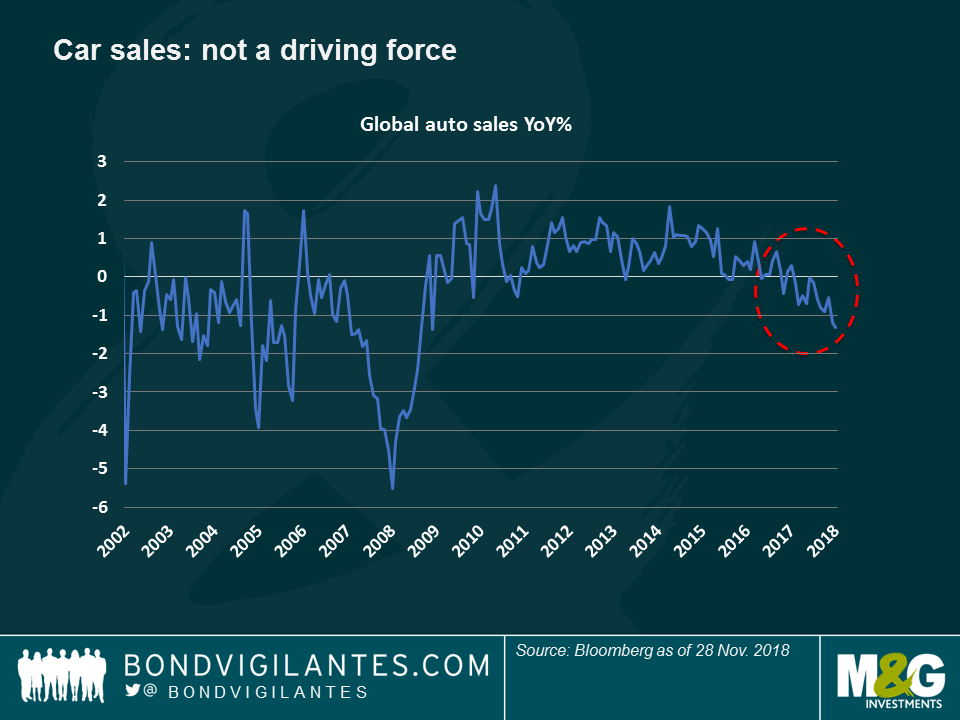
Cars – canary in the coal mine? Car sales have stopped being an economic driver – they feel more like a puncture to the wheels of global growth: maybe this is because of global trade wars; maybe because developed market average populations are getting old and youngsters use on-demand services, or perhaps because the EU has introduced a new pollution-testing regime. As seen in the chart, annualised growth of global auto sales is falling deeper into negative levels, something which has made the industry the worst-performing US High Yield sector so far this year, down by 7.3%. Earlier this week auto giant GM said it planned to close as many as five North American plants and cut staff. To make matters worse the IMF doesn’t see a rosier picture ahead – the fund expects growth to moderate, especially in developed economies because of aging demographics, slow productivity and rising rates. In the US, the end of the recent fiscal stimulus may also hinder growth. High Yield investors seem to have priced in the tough times ahead: the more resilient Supermarkets and Pharmaceuticals are the best-performing HY sectors this year, up 7.8% and 6.7%, respectively.
TIPS – tipping over: US Treasury Inflation-Protected Securities have lost investors 0.6% over the past five trading days, taking their year-to-date loss to 2.7%. The drop has been mostly driven by plummeting oil prices and unconvincing data. Still, some investors argue that with US 10-year nominal yields at 3.0% and breakeven rates (or inflation expectations) at 1.93%, a real rate of more than 1% is attractive relative to the negative real rates that are still prevalent in most developed countries where the inflation rate is above the base policy rate.
November is proving to be even worse than October, especially for Credit markets, amid plunging oil prices, corporate woes, executive scandals and protracted unconvincing economic data, all on top of a global interest rate rising cycle. Corporate bonds, which have been supported by loose monetary policy for over a decade, particularly felt the cold: US Investment Grade (IG) spreads last week posted their biggest weekly jump (11%) since 2011, when the world feared a European Union break-up. IG spreads continued to rise this week to 132 basis points (bps) over Treasuries, the highest level since Trump won the US election in 2016 (more below).
The sharp corporate bond and equity losses increased market expectations that the Fed may reduce or even halt its rate hiking path. Inflation expectations dropped, supporting Treasuries and German bunds, whose yields also fell on safe-haven demand. Some Emerging Markets (EMs) showed resilience, especially in Asia, as cheaper oil is positive for its energy-importing economies. Still, a generally stronger US dollar over the past two months led (among other reasons) to defensive interest rate hikes in Indonesia, the Philippines and Mexico. Oil exporting countries, including Nigeria, Angola and Ghana, suffered as the commodity plunged, following a drop in expected demand. Some value investors returned to the market in search of bargains, following the sell-off.
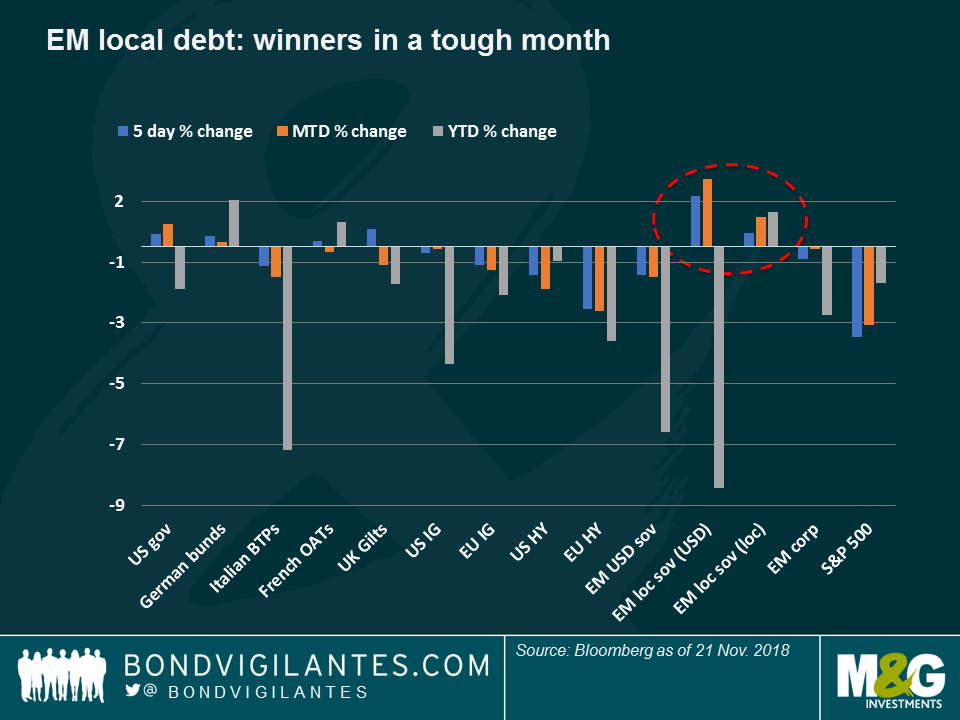
EM local – November MTD global winner: EM locally-denominated sovereign debt has returned 1% to investors so far this month, and 2.2% when translated into US dollars, as some currencies have posted strong gains against the greenback. Asia, a traditionally good performer in times of trouble given its relatively healthy foreign accounts, led gains, as its oil-importing countries are also set to benefit from cheaper energy. Asian countries are also somewhat supported by China, which seems committed to fiscal stimulus in order to offset any potential damage caused by the ongoing trade war with the US. This support has kept the returns of Chinese government bonds in the black so far, both this year and also over the past 12 months (3.1%). On a country basis, it was Russian sovereign debt that posted the best 5-day return (4.5%), among 100 Fixed Income asset classes, as concerns over the US sanctions that it faces wane. The fears have pushed the ruble down 12% against the dollar so far this year, something which may help the country beat its record 2008 Current Account surplus in 2018, according to some analysts. Chilean local bonds were the second-best performing Fixed Income asset class over the same period, on the back of rising copper prices and below-target annual inflation.
Gilts – que sera, sera? UK borrowing costs fell over the past five trading days, with 10-year gilt yields reaching 1.39%, down from 1.72% barely one month earlier. The week was tumultuous as a draft agreement reached with the EU over Britain’s departure was soon put into question by the resignation of two Cabinet ministers. The safe-haven rally continued as Conservative MPs said they were increasing efforts to oust Prime Minister Theresa May, a move which might lead to a disorderly exit or a new general election. For more on Britain’s Brexit scenarios and its potential market outcomes, watch M&G fund manager Ben Lord.
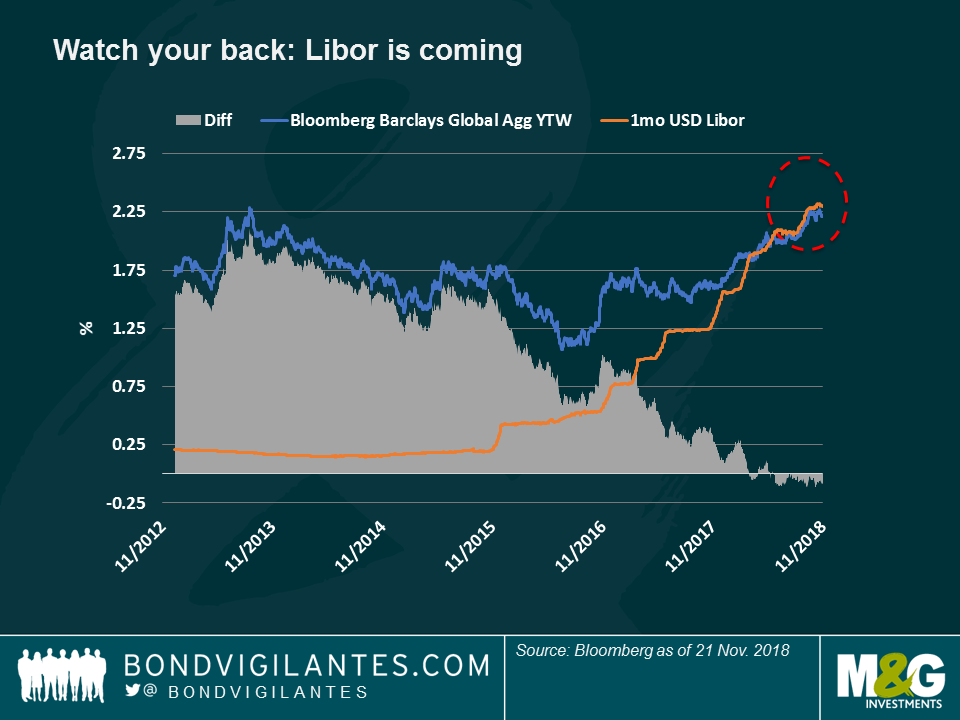
Credit’s Thanksgiving table – cold Turkey: After more than doubling in size (to $5 trillion) over the past decade, US IG debt is suddenly remembering what higher rates, a less supportive central bank and a less expansive economy look like. As M&G fund manager Lu Yu warned a few weeks ago in “Beware of the debt binge”, companies that have (mis)used debt to increase dividends or buy back shares, instead of shoring up their balance sheets, are now forced to reverse those policies, upsetting equity holders and raising questions about their debt servicing capabilities at higher rates. Financial companies have been the worst hit within the US IG universe, as the economic pick-up has failed to lift long-term rates, resulting in a year-to-date flatter yield curve that depresses their profit margins. Oil, which represents a heavy c. 15% on both US IG and High Yield (HY) indices, has also suffered. European HY has fared even worse in November, mostly dragged down by struggling Italian infrastructure companies and by a loss of growth momentum: Germany’s economy shrunk in the third quarter. Fears of the impact of a downgrade of US industrial giant General Electric down to HY are also raising concerns of a sharp increase in US HY supply, usually a negative for prices. Finally, and as seen on the chart, US issuers also face competition from Libor, the rate at which banks lend money to each other; often seen as a proxy for risk-free rates, Libor is now higher than the Bloomberg Barclays Global Aggregate yield, something which could deter investors from buying corporate or sovereign bonds, as they receive better compensation elsewhere, with, in principle, less risk. Some investors, however, argue that this week’s sell-off is overdone as the US economy is still growing at a fast pace. Companies also tend to pay fixed coupons to investors, so the effect of higher rates might not be as dire as markets are pricing in.
Argentina – new rate floor? Trying to bring the beleaguered economy back to normal while keeping investors happy may be trickier than it seems: at 62.5%, the benchmark interest rate has lured yield-hungry international investors, bringing a certain stability to a country reliant on an IMF rescue package. Investors, though, speculate that the central bank’s 60% floor for interest rates may be eliminated soon if inflation expectations continue to drop, depressed by the economic recession. Lower rates may bring a relief to the economy, and to Prime Minister Macri, who will seek re-election in October next year – but they may not be as welcome by carry-seeking investors: Argentinean bonds fell 2.7% over the past five trading days, the second-worst performance in the Fixed Income universe.
After more than two years of bitter discussions, leadership battles, thousands of hours and millions of pounds spent on a divorce agreement between Britain and the EU, sterling barely blinked when a draft deal was finally struck. Investors held off in an uncertain environment, only to move quickly when further uncertainty unfolded: the pound sold off and gilts rallied after two cabinet ministers quit, raising speculation of a leadership challenge and a potential general election. A weaker currency fuelled inflation expectations, with the five-year breakeven rate spiking 3.9%, the biggest jump since 2015. As gilts, German and French sovereign bond yields dropped on safe-haven demand, while Italy, Spain, Portugal and Greece saw their borrowing costs nudge higher.
Either caused by Brexit or by the ongoing China-US trade friction, the backlash on global trade is beginning to bite: the German economy shrank by 0.2% in the third quarter, the first in three years, while Japan’s contracted 1.2% over the same period. China published hot-and-cold October data, while October US inflation and the latest loan demand data came in slightly soft. OPEC’s warning of weakening oil demand sent crude prices tanking for a record 12 days in a row (more below). Traditional safe-haven assets, such as US Treasuries, the yen and the US dollar, outperformed.
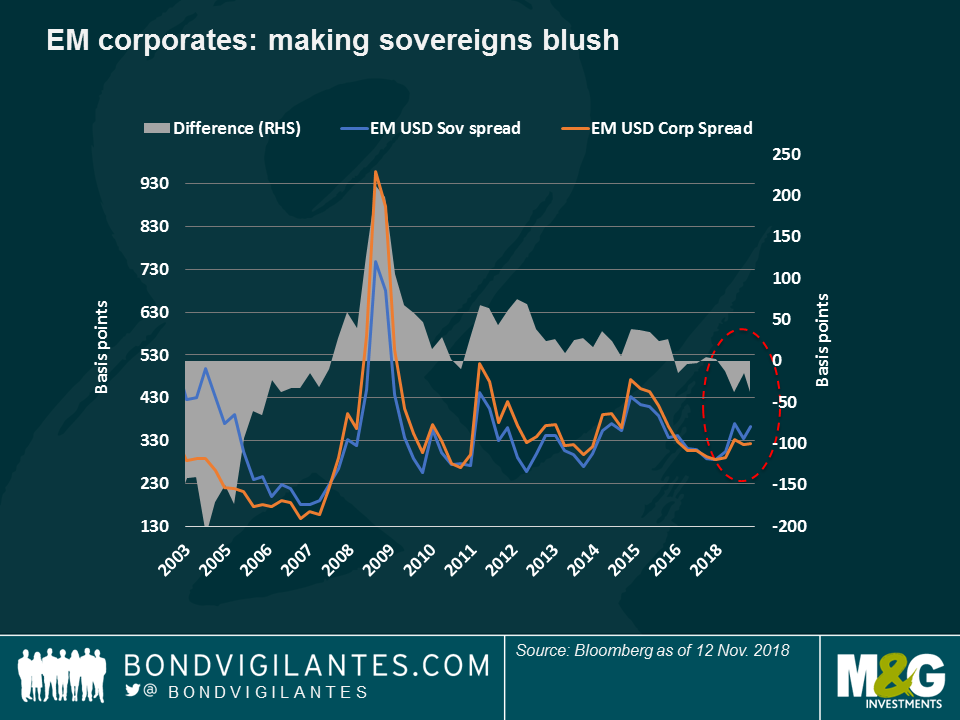
Emerging Market (EM) Companies – more trustworthy than governments? The premium that investors are paid to hold EM corporate over EM sovereign debt has, traditionally been high as governments tend to have a better reputation with creditors. Not only has this fallen but it has reversed: as seen in the chart, EM corporate spreads now trade inside EM sovereigns’, reaching a gap of 37 basis points, the highest since 2006 – when leading corporate indices were mostly dominated by state-controlled firms that were perceived as relatively safe. The financial crisis brought sovereigns back into the less risky camp, as most EMs didn’t have to incur costly bank rescues. This situation continued until earlier this year, especially in the summer, when the crisis in Turkey and Argentina spread to other EM sovereigns. Corporate spreads, on the contrary, have not risen as much, underpinned by the outperformance of Asian firms, China’s well-stimulated economy and, of recent, also on hopes that December’s US-China summit may deliver a trade truce, helping the region’s exporters. This week’s collapse in oil prices is also good news for oil-importing Asia. Over the past five trading days, the top 20 (of 100) Fixed Income asset classes tracked by Panoramic Weekly included as many as 8 different Asian corporate indices.
New Zealand – up and above: After decades of being boxed as “down under,” at least New Zealand bond holders may now claim the opposite: the country’s corporate and sovereign debt have both outperformed a list of 98 other Fixed Income asset classes over the past 30 days on the back of a strong economy and contained interest rates: the jobless rate unexpectedly dropped to a 10-year low in the third quarter, while the central bank left rates unchanged last week. The kiwi dollar is the best-performing G10 currency against the US dollar so far in November, up 4.3%, and cutting down its year-to-date loss against a rising greenback to 4.2%.
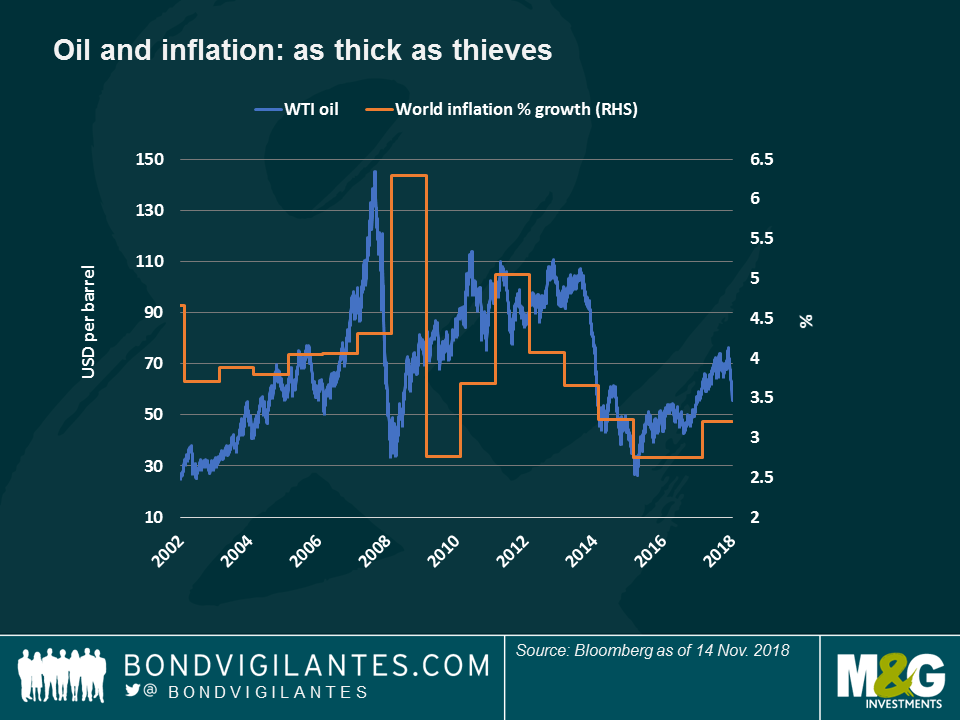
Oil – crude times: Generally a reflection of the global economy’s heartbeat, oil prices sank to $56 per barrel, down from $76 last month, after OPEC’s latest monthly report showed increased Saudi Arabia supply and reduced demand forecasts. Leading institutions such as the IMF have cut their global growth forecasts this year, citing lower momentum in Europe and Asia, the negative effect of trade wars and prospects of rising rates after a decade of loose monetary policy. Some investors also question the sustainability of the US strong economic streak once the effects of the recent corporate tax cuts wane. US corporates suffered from the oil collapse, as credit spreads of oil-heavy indices, such as US Investment Grade and High Yield (Energy accounts for about 15% of both), widened. On the other hand, currencies of oil importing countries, such as Turkey and India, surged against a rising dollar. Those of oil exporting nations, such as Mexico, Brazil and Russia, have lost between 1.25% and 2.25% so far this month. Lower oil prices, though, are generally perceived as positive as inflation expectations, and interest rate forecasts, drop. As seen in the chart, inflation and oil are strongly linked.
Mexico – not flying: Mexican government bonds were the worst-performing Fixed Income asset class among the 100 tracked by Panoramic Weekly, down 4.1% over the past five trading days and 11% over the past 1 month period. Once excited about Lopez Obrador’s prospects as new president, investors now seem to be losing faith: his decision to cancel a $13 bn new airport, when one third is already complete, has not been welcomed, while his proposal to call referendums on the construction of a refinery and a tourist train have raised uncertainty. Also expecting higher future interest rates, investors seem to have grounded bonos for now.




Sign up to the Bond Vigilantes mailing list to ensure you never miss a great article from our expert Bloggers. We will email all new articles to your inbox, meaning you can stay on top of the world of Bonds.
I confirm that I would like to receive information about Bond Vigilantes and products and services from M&G Securities Limited.
We will use the email address and personal data you have shared with us to send you this information. For existing customers, submitting your contact details and requesting to receive this information from us, will replace any earlier choices you have made in respect of marketing information.
You can unsubscribe from marketing at any time, at which point we will not send any further marketing information to you, by selecting the unsubscribe link in all communications.