






Rolldown – The credit edition

We previously blogged (A dispatch from the number crunchers – Yield curve rolldown – Bond Vigilantes) on which area of government bond curves investors should have exposure to if they want to receive the greatest benefit from the passage of time. In a normal/upwardly sloping yield curve environment, the yield of a bond will fall (and its price will rise) the closer it gets to maturity. Or, as it rolls down the curve.
In summary, 20 years of historic data tells us that in the UK, Europe and the US investors should look to the 3-5yr area of government bond curves for the best risk adjusted returns.
The natural follow up question is; does the same phenomenon exist in credit? To explore this we again took 20 years of bond level index data and measured the extent to which the credit spread (the yield premium received for investing in a corporate bond yield rather than its equivalent benchmark government bond) changed as bonds rolled down the curve towards maturity. We looked at both investment grade (IG) and high yield (HY) bonds in Europe and the US, but in the UK lacking a fully developed HY market we limited our analysis to IG.
The broad conclusion was similar. In all three currencies, the 2-7yr area of the curve generated the highest levels of spread roll down (SRD) per unit of risk.
We define spread roll down, or more accurately “spread roll down efficiency per duration” as:
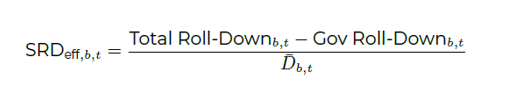
In English, this means we isolated the credit spread roll down return per month, and divided it by the interest rate risk (duration) inherent in the bonds. This gave us the risk adjusted spread rolldown.
Source: M&G, annualised monthly roll down return %, IBoxx Corporate indices using end of month data from July 2006 to May 2026
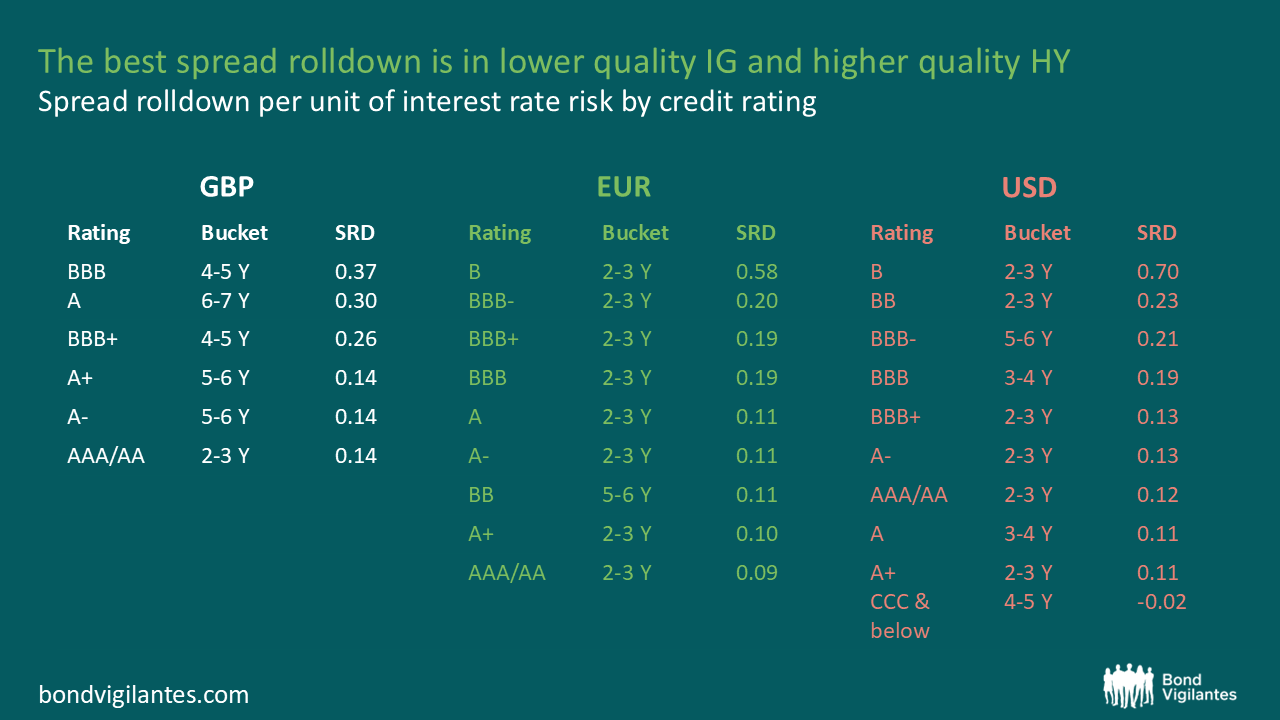
The results were slightly different depending on the currency. Firstly, and remembering we excluded HY, in Sterling 4-5yr BBB bonds offered the highest levels of SRD efficiency:
In Euros, almost uniformly across the credit rating buckets, the 2-3yr bucket was the top performer. And, in terms of credit rating, investors got the best bang for their buck in the single Bs and the lower reaches of IG.
It was a similar story in Dollars. The single B to BBB+ buckets were again the place to be, albeit with a bit more dispersion in the maturity profile – but let’s call it 2-6yrs for simplicity’s sake.
To simplify further, here’s how each maturity bucket stacked up across all credit ratings in the three currencies:
GBP
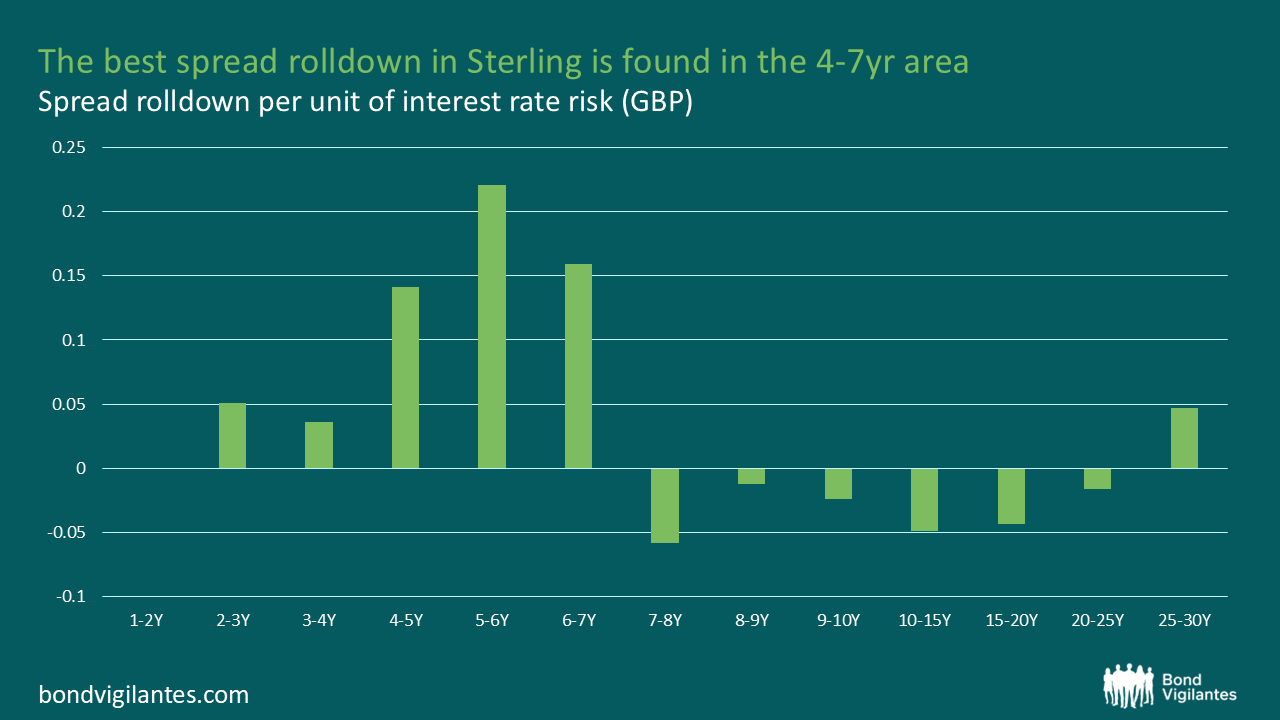
Source: M&G, annualised monthly roll down return %, IBoxx Corporate indices using end of month data from July 2006 to May 2026
EUR
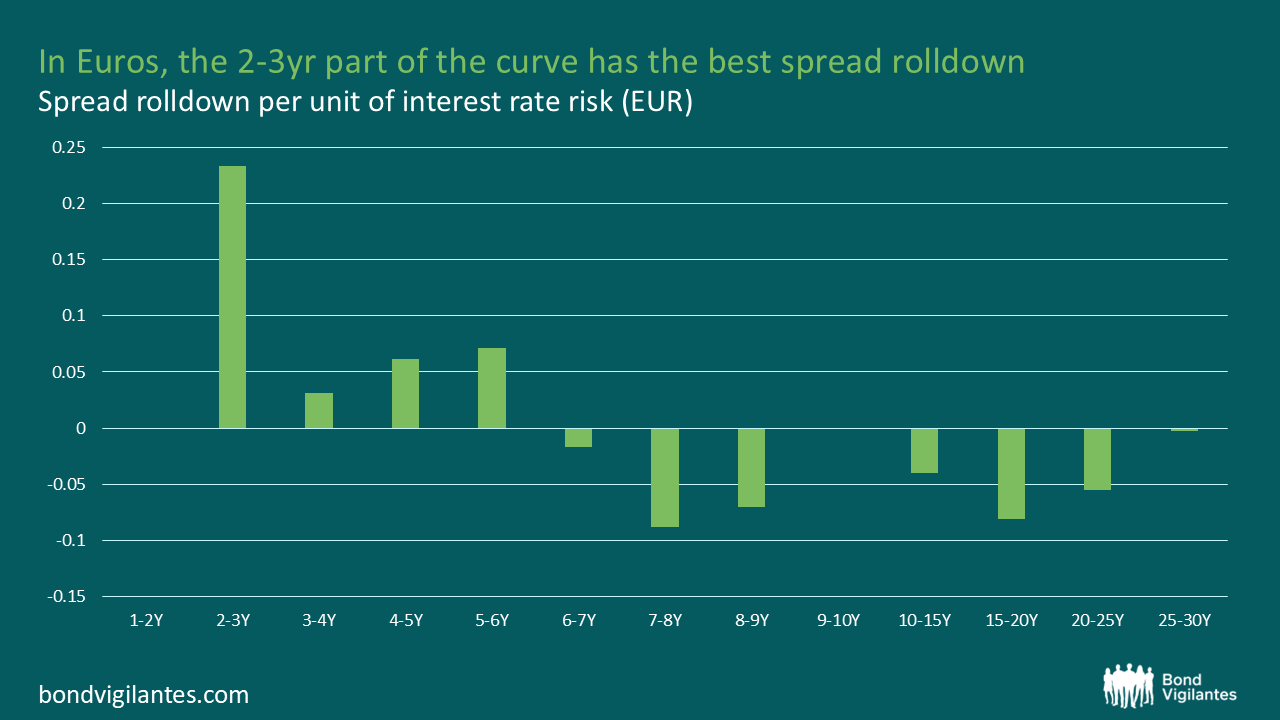
Source: M&G, annualised monthly roll down return %, IBoxx Corporate indices using end of month data from July 2006 to May 2026
USD
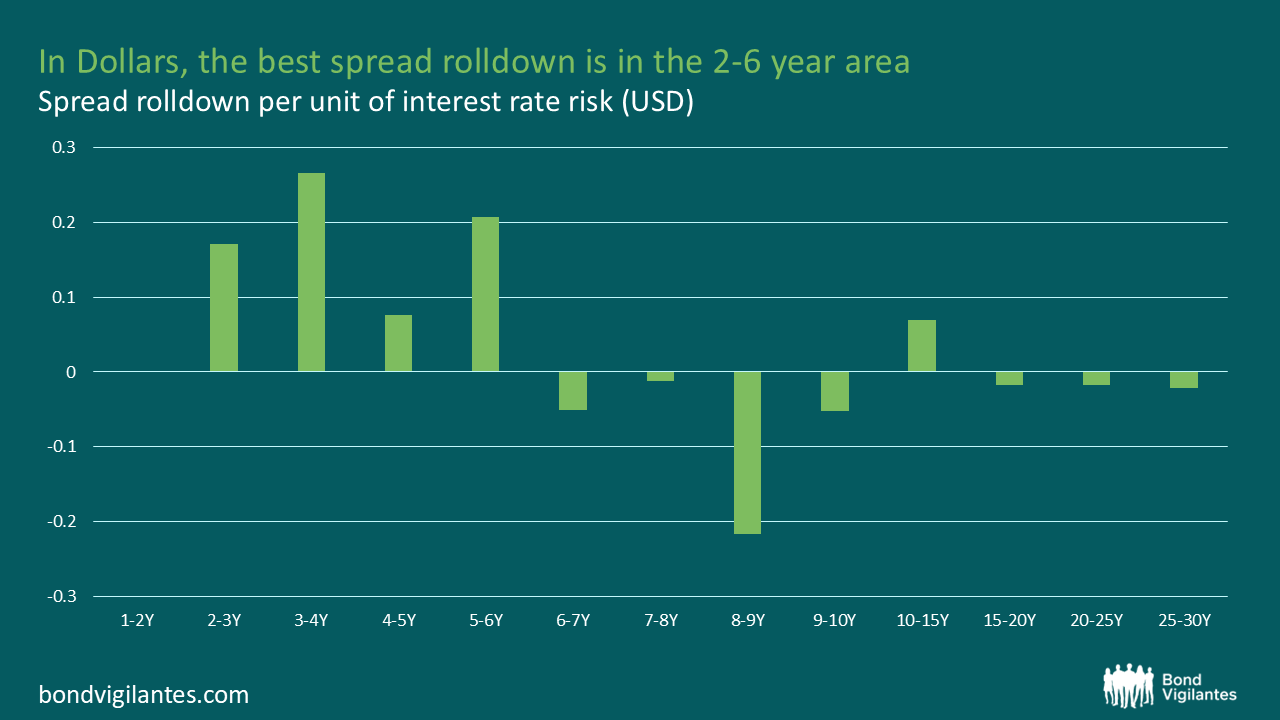
Source: M&G, annualised monthly roll down return %, IBoxx Corporate indices using end of month data from July 2006 to May 2026
It’s important to remember that longer dated bonds may not be great at capturing rolldown, but if you get your credit and duration calls right there is vastly more money to be made by investing further out the curve.
Still, I think it’s good to know that the “free lunch”, as some have described rolldown, is on the menu in corporate as well as government bonds.
The value of investments will fluctuate, which will cause prices to fall as well as rise and you may not get back the original amount you invested. Past performance is not a guide to future performance.