






A distressed tail is wagging high yield spreads

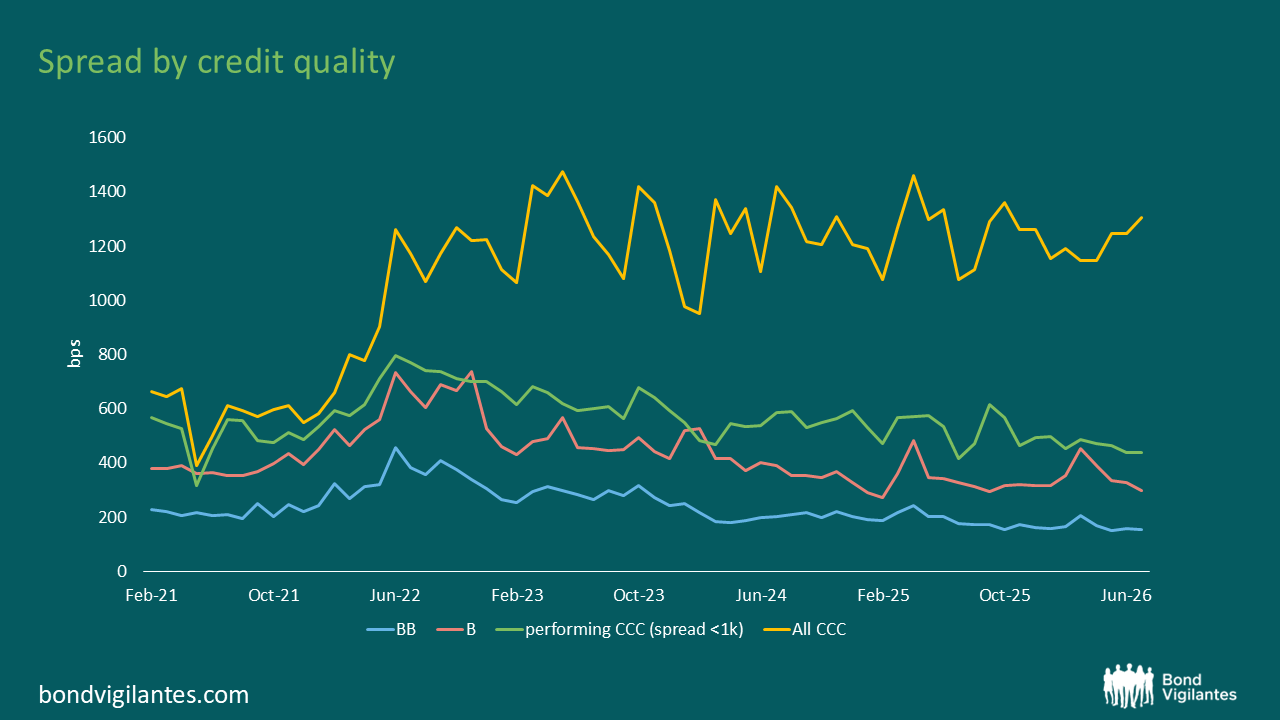
In a world of tight credit spreads, one rating bucket flashes value. The European CCC index offers 1,306 bps over government bonds, suggesting generous compensation for taking credit risk.
But the spread is deeply misleading.
The CCC market contains two very different groups: performing companies that are riskier but continue to meet their obligations, trading on spread, and distressed companies that are trading on expected recovery values following a restructuring. Combining the two produces an index spread that describes neither particularly well.
Two markets sharing one rating
Performing CCC bonds, defined here as those trading below 1,000 bps – a common threshold for distress – currently offer a spread of 438 bps. That is tight by historical standards and much closer to the spreads available from higher-rated single-B bonds than the headline CCC figure suggests.
These are companies that the market broadly expects to continue servicing their debt. Investors still face meaningful default, downgrade and liquidity risk, but they are not being paid anything close to 1,306 bps to accept it.
Above 1,000 bps, the analysis for a bond changes. The outcome and timing of a potential restructuring dominate the price of the bond. The lower chance of a return to par makes the spread a poor guide.
The aggregate CCC spread therefore combines conventional spread assets with potential recovery assets and so is a poor guide to the compensation available on performing CCC risk.
Source: Bloomberg, ICE BofA BB Euro High Yield Index (HE10), ICE BofA Single-B Euro High Yield Index (HE20), ICE BofA CCC & Lower Euro High Yield Index (HE30)
The distortion extends beyond CCCs
CCCs account for only 4.3% of the European high yield index. If the distortion were confined to that small part of the market, it would be interesting but of limited relevance. It is not confined to CCCs.
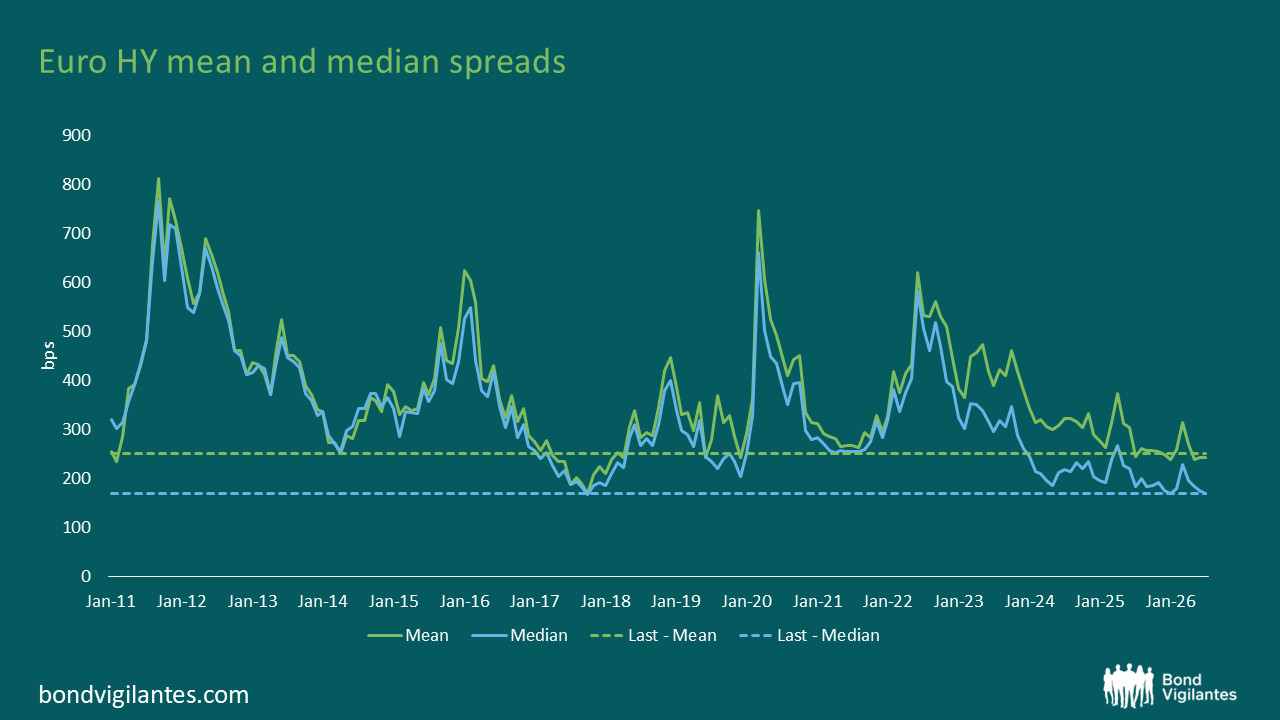
Across the broader European high yield market, a relatively small number of distressed bonds can have a disproportionate effect on the average spread. These securities record extremely high spreads even when spread is no longer the most useful way of valuing them. Their presence pushes the average above the level available on most performing bonds.
The gap between the mean and median illustrates the effect. The mean is sensitive to the size of the observations in the distressed tail. The median is not. It identifies the spread on the middle bond in the distribution, regardless of how extreme the widest spreads become.
The median spread gives a better indication of spreads for a typical bond and hence the outlook for future excess returns.
At present, those two perspectives tell different stories. The headline mean index spread of 244 bps suggests that European high yield offers reasonable compensation. The median, which at 169 bps is close to the tight end of its range over the last 5 years, suggests that the typical performing bond is priced much more aggressively.
Source: Bloomberg, ICE BofA Euro High Yield Index (HE00)
How to read the market
Most investors treat the index spread as a quick read on value. It isn’t always. When distressed bonds contribute an outsized share of that spread, the headline flatters the performing market that makes up the bulk of what you can actually buy.
So the aggregate is the wrong anchor. For performing CCCs, the only question that matters is whether 438 bps pays you for the default, downgrade and liquidity risk you are taking versus a single-B. It is a thinner cushion than the index spread implies. Distressed CCCs are a different game entirely, priced on restructuring outcomes and recovery, not spread.
The lesson is to read the market through the median, the spread distribution and the share of bonds trading at distressed levels, not a single average that a small tail can distort.
In CCCs, the real risk is not always distress; it is paying too much for the credits that avoid it.
The value of investments will fluctuate, which will cause prices to fall as well as rise and you may not get back the original amount you invested. Past performance is not a guide to future performance.