






The Honey Badger Market

Anyone who spent too much time on YouTube in the early 2010s will probably remember the Honey Badger. The Honey Badger is part of the Mustelidae family which includes Wolverines, Otters and, you guessed it, Badgers. They live mostly in Africa, the Middle East and India…and oh, they are super cute too.

But don’t let those looks deceive you. They are notoriously dangerous, smart, resourceful and resilient. The YouTube meme had a simple premise, despite being bit by cobras (falling asleep because of their venom only to wake up and eat said cobra), hundreds of bee stings as it tried to eat the nest’s honey, or fighting-off lions, leopards and wild dogs; no matter what the honey badger encountered, the narrator always declared: “Honey badger don’t care.” A testament to its strength and resilience. Looking at a chart of US High Yield spreads over the past dozen years, it’s hard not to think of that meme.
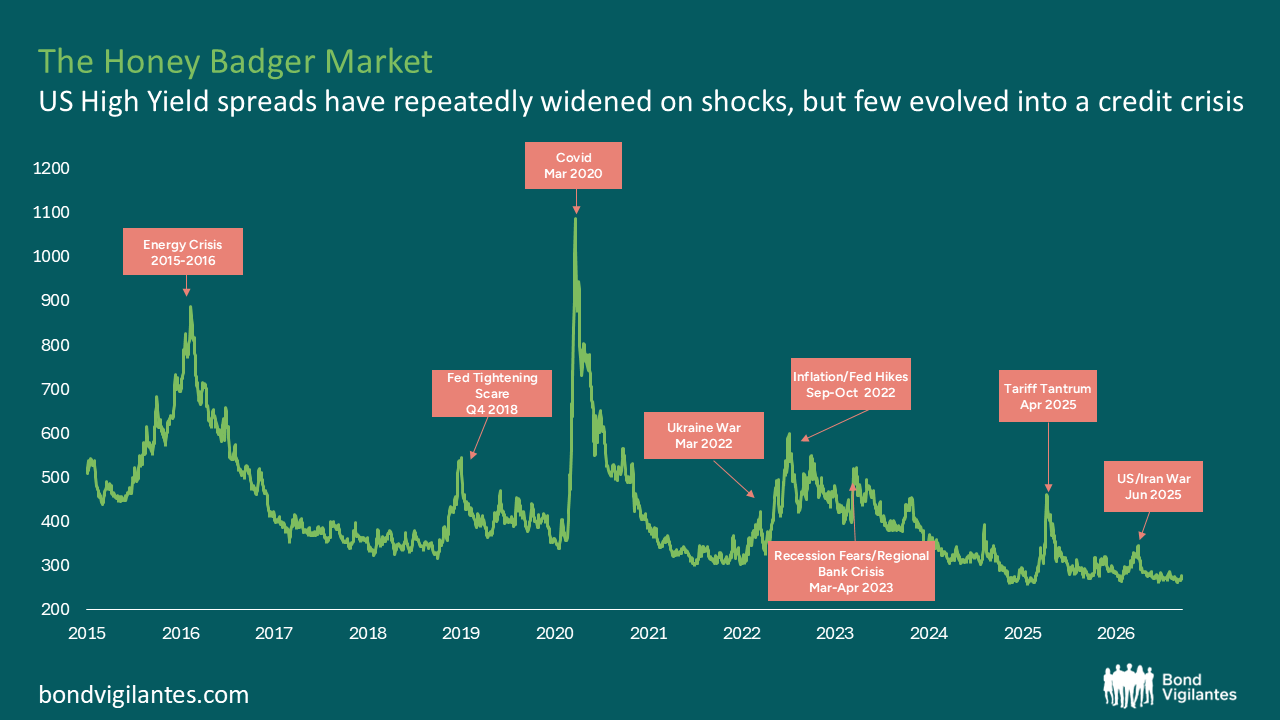
Source: Bloomberg, ICE BofA US High Yield Index (H0A0), 17 September 2026
You could almost narrate the period as follows:
- Oil bubble burst? High yield market don’t care. *
- Fed Tightening Scare? High yield market don’t care.
- Global pandemic? High yield market definitely cares…for about a year. *
- Ukraine War? High yield market don’t care.
- Inflation/Fed Hikes? High yield market cares…then gets over it.
- Recession Fears? High yield market don’t care.
- Tariff Tantrum? High yield market don’t care.
- US-Iran War? High yield market don’t care.
That’s a bit of an exaggeration. US High Yield hasn’t ignored these shocks, but it has generally recovered in relatively short order. Every one of those events caused spreads to widen, in some cases dramatically, but what stands out is how rarely those shocks evolved into the broad credit crises investors initially feared.
For example, the recession widely expected in 2022 never arrived, corporate earnings held up better than feared and defaults remained relatively contained. Again and again, events initially viewed as the start of a broad credit downturn turned out to be something less severe than feared.
Part of that may be that the market looks different from the one investors often compare it against. BB-rated bonds (higher quality HY issuers with regard to credit metrics etc.) accounted for c.38% of the US High Yield index in 2007, and by 2026 that has risen to c.60%. Over the same period, duration fell, secured issuance increased and refinancing largely replaced acquisition financing as the dominant use of proceeds in the new issue market.
One could also cite the influx of fallen angels, although those often migrate back to investment grade and are replaced by other fallen angels. But it also says something about how credit markets have evolved. Over the past decade leveraged loans and private credit have funded many of the more-speculative borrowers that traditionally financed themselves in the cash high yield market.
I recall discussing with market participants years ago our concern over the shrinking size of the high yield market as private credit and leveraged loans continued to gobble up market share. With hindsight, perhaps they were doing high yield investors a favour. That said, it is important to distinguish between different segments of the private credit market. Much of the recent stress has been concentrated in parts of the US private credit universe,where some loan and private credit funds have recently been burned by the lower-quality composition of their portfolios. They have also been singed by issuer concentration, particularly during the recent sell-off in certain technology-related issuers, as those asset classes are disproportionately skewed towards technology relative to high yield.
Interestingly, amid the recent revival of issuance an increasing number of previously loan-only issuers have been approaching the high yield market, perhaps a sign that funding options in US loans and private credit are becoming less abundant as some funds either come under pressure or lack the capacity to continue funding weaker issuers. Not enough to materially alter overall index quality in the near term, but it is something worth monitoring.
Beyond issuer quality, strong technicals have also helped keep spreads tighter than many expected, or perhaps more accurately, tighter than many had become accustomed to. New issue supply has until recently been suppressed, partly owing to the surge in demand for loans and private credit as discussed earlier. Meanwhile, demand for yield remains robust, creating an imbalance that has helped contain spreads. Investors earn returns through yield and carry, not spread alone, and higher base rates support attractive all-in yields despite relatively tight spreads. Especially if they can earn attractive yields in a higher quality (i.e. safer) product than previously. This can also help draw buyers back into the market during bouts of volatility, helping to contain spread widening. I’ve argued before that we may be operating in a structurally tighter spread environment and previous assumptions around high yield fair value need revisiting.
Energy and Covid probably deserve an asterisk*. Energy was the largest component of the Index when things went asunder, which skews overall index behaviour. If one strips out energy from the broader index, whilst still widening, it recovered even more quickly than represented above. With Covid, unlike some of the other episodes on the chart, that recovery was driven more by policy than fundamentals or technicals. Massive fiscal stimulus and monetary support helped prevent an even worse default cycle than many feared would occur. The irony, of course, is that many of those same measures that aided recovery also contributed to the inflation concerns that spurred the next major widening episode in 2022.
That’s why the honey badger analogy feels appropriate. Not because the high yield market doesn’t care about shocks. It clearly does, every episode on the chart resulted in wider spreads and a sharp repricing of risk. What stands out is how none of those shocks evolved into a broader credit crisis. The market gets knocked around, reassesses the risks and then carries on.
No one can predict how, or from where, the next crisis will emerge. We are operating in a higher-rate environment, the US 10YR is hovering around 5% and, if this persists, higher borrowing costs could pressure earnings/cash flow and create challenges for some issuers as debt maturities and refinancing needs arise. Will this lead to a broader credit event? Do sustained oil prices spur more inflation, pressure earnings and slow growth? China makes good on its threats and invades Taiwan? AI major escape? Or, as more UFO (or UAP, as they are now called) data and evidence is released by the U.S. government, an alien invasion? Ok, the last one seems the least likely, although it appeals to my inner conspiracy theorist.
Not to sound sanguine, but whatever manages to shock the market next, changes in index composition, supportive technicals and a shifting financing ecosystem suggest that future spikes in volatility will likely be absorbed and actually create attractive buying opportunities given the context I’ve posited.
The Honey Badger market may not be invincible, but over the past dozen years it has earned a reputation for being remarkably difficult to keep down.
The value of investments will fluctuate, which will cause prices to fall as well as rise and you may not get back the original amount you invested. Past performance is not a guide to future performance.